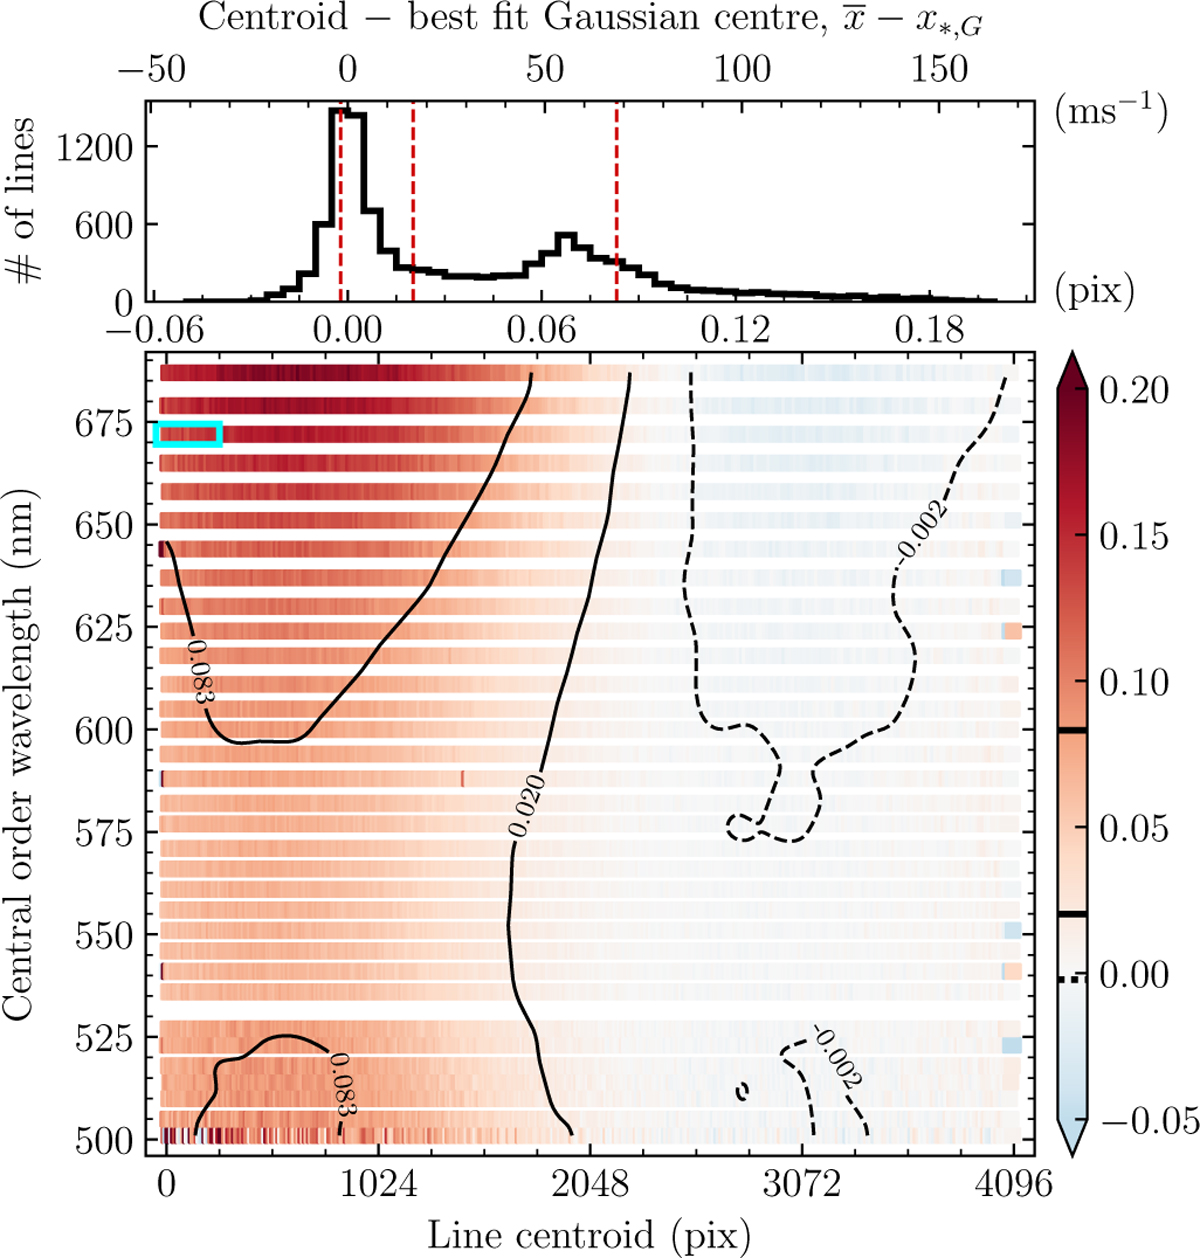
Fig. 3
Download original image
Astrocomb line shape asymmetry as a function of position on the HARPS detector. Main panel: each coloured square shows one of the 10 576 detected astrocomb lines in the HARPS astrocomb spectrum described in the text. The position of the square in the (x,y) plane approximately matches its position on the HARPS detector frame. The gap seen at ≈ 525 nm is due one echelle order falling between the two HARPS detector CCD chips so is not recorded. Wavelength within a single echelle order increases towards the right. The colour of the square is proportional to the difference (in units pixels) between the measured line centroid and the line position determined by fitting a Gaussian IP to the data. The zero point of the colour bar to the right is set to zero, such that the blue and the red colours denote negative and positive differences, respectively. Smooth variations across the detector most likely correspond to IP shape variations. Contours over smoothed data are plotted to visualise trend more clearly and emphasise where certain values cluster. Contour levels correspond to the 16th, 50th, and 68th percentile of the values, i.e., −0.002 pix, 0.020 pix, and 0.083 pix. Full lines are used for positive levels and dashed lines for negative. The cyan rectangle indicates the location of the 1st segment in optical order 90, for which we show an empirical IP model in Fig. 4. Top panel: Histogram of the values shown in the main panel. The secondary x-axis on the top shows the line centre differences in units m s−1 (1 pix = 820 m s−1). The vertical dashed red lines show the positions of the distribution median and the central 68% distribution limits. The same quantities are shown as thick black lines in the colour bar.
Current usage metrics show cumulative count of Article Views (full-text article views including HTML views, PDF and ePub downloads, according to the available data) and Abstracts Views on Vision4Press platform.
Data correspond to usage on the plateform after 2015. The current usage metrics is available 48-96 hours after online publication and is updated daily on week days.
Initial download of the metrics may take a while.