Fig. D.1
Download original image
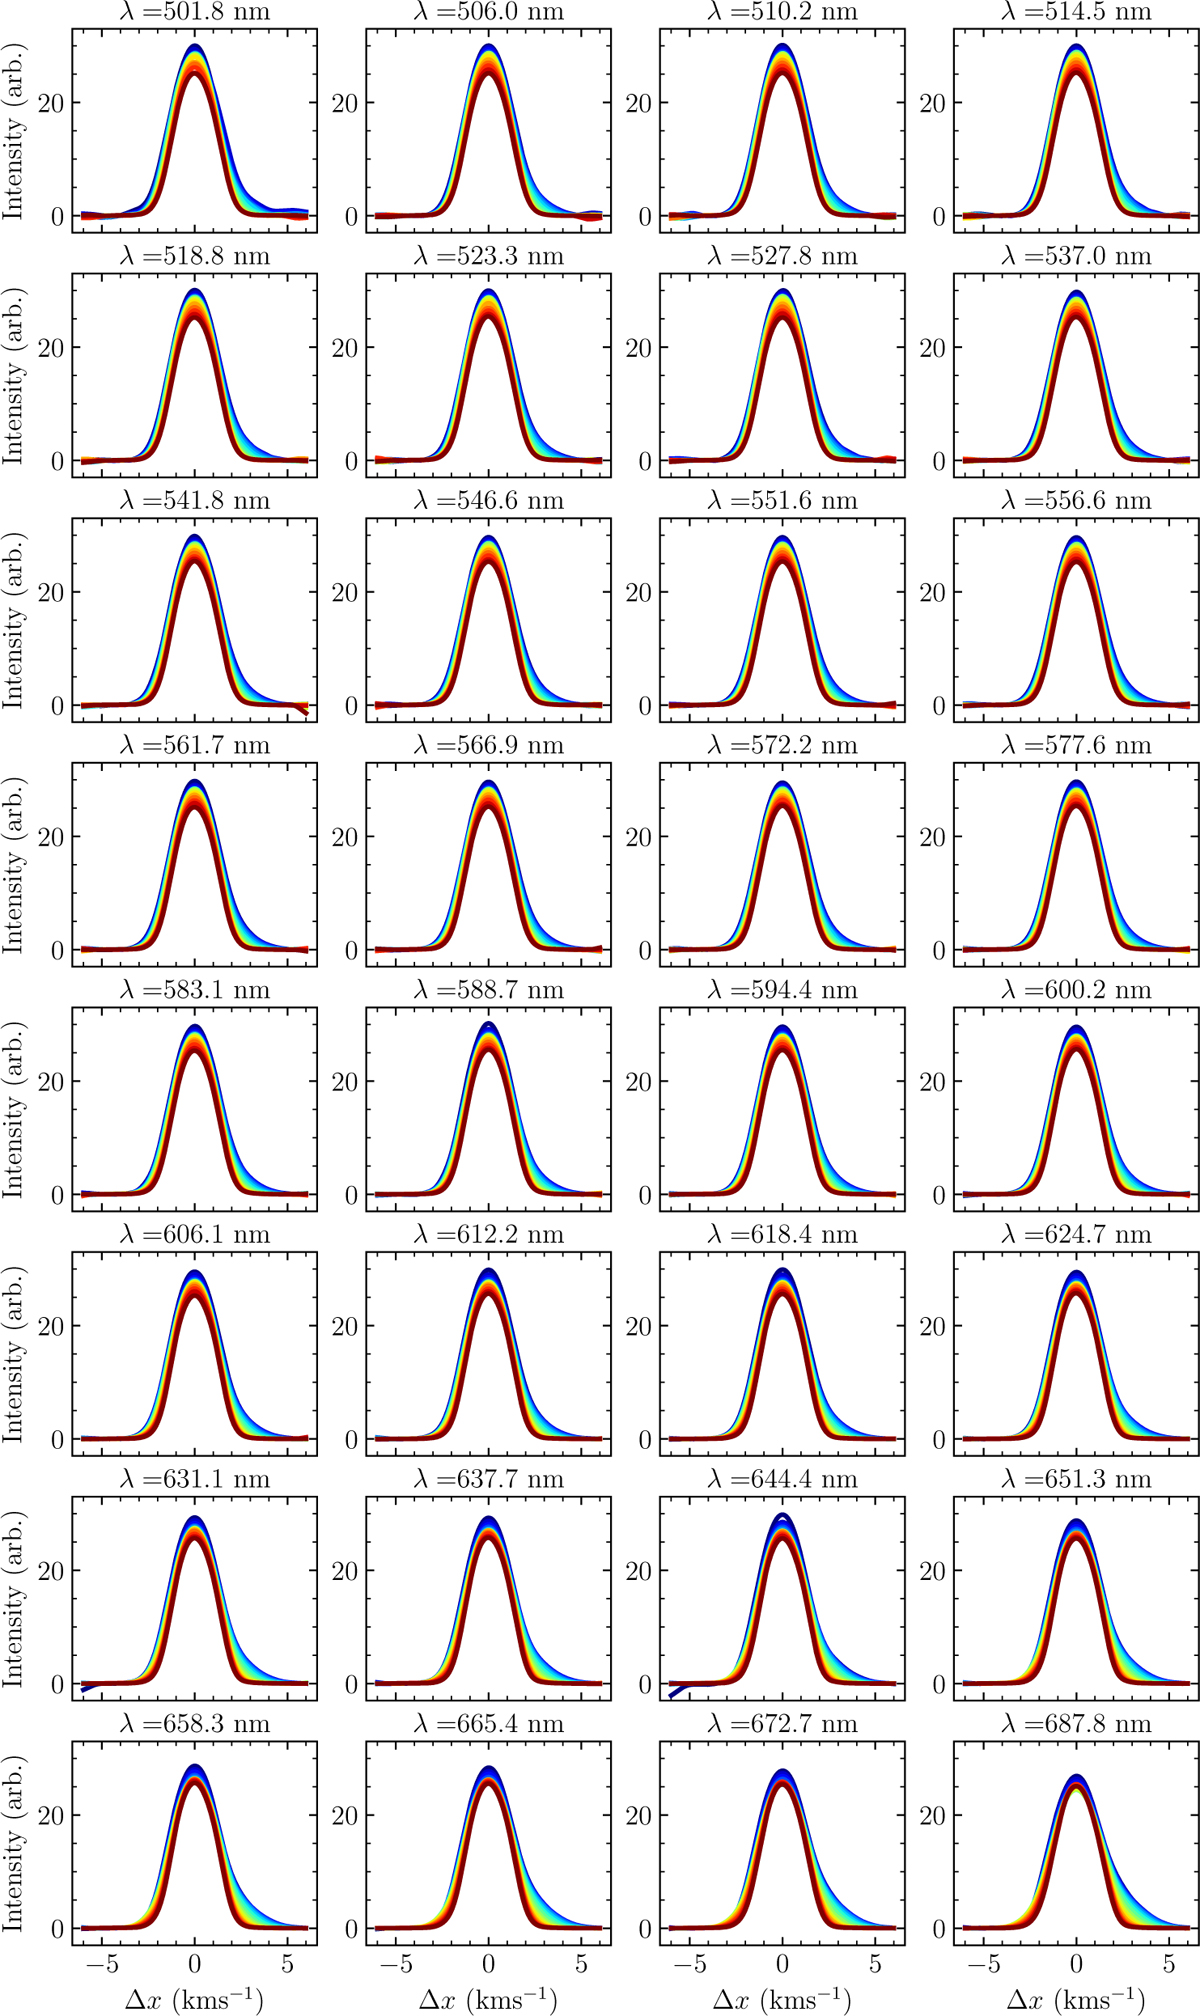
HARPS IP models in velocity space for orders 89 through 122. Each panel shows the IP in 16 segments of one order, whose central wavelength is printed above it. Line colour within the panel changes from blue to red with increasing wavelength. The same plots with background reference grids (which make it easier to see the profile changes) can be found on the arXiv version of this manuscript https://doi.org/10.48550/arXiv.2311.05240.
Current usage metrics show cumulative count of Article Views (full-text article views including HTML views, PDF and ePub downloads, according to the available data) and Abstracts Views on Vision4Press platform.
Data correspond to usage on the plateform after 2015. The current usage metrics is available 48-96 hours after online publication and is updated daily on week days.
Initial download of the metrics may take a while.