Fig. C.1
Download original image
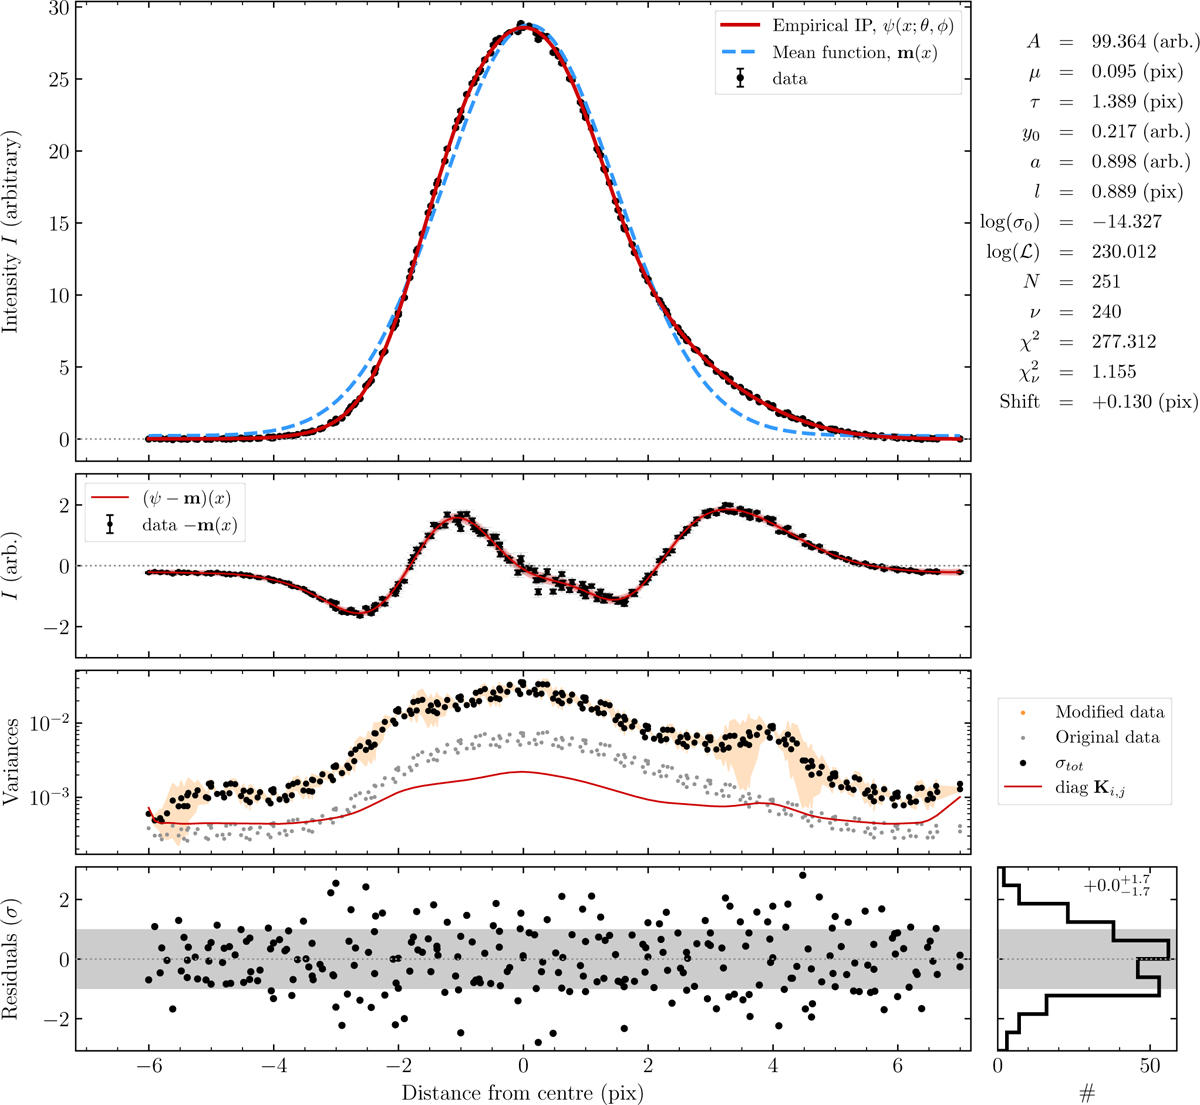
Detailed view of the IP model for a single segment. First panel from the top: The black points are the 251 samples of the IP, ![]() , in the first segment of order 90 derived from flux normalised and stacked astrocomb lines (Eq. (10)). The thick red line is the empirical IP model, ψ(x) in the first iteration. The model was derived by performing a GP regression on the black points (Sect. 2.4) with a secondary GP for variance estimation. The dashed blue line is the mean function of the GP, Eq. (17). The numbers to the right of the panel give additional information. The first seven numbers are the values of the parameters (θ, ϕ, σ0) that minimise the loss function, − log 𝓛, where 𝓛 is the model likelihood (also quoted). N and v are the number of data points and the number of degrees of freedom in the fit, respectively. χ2 is given by Equation (22) and
, in the first segment of order 90 derived from flux normalised and stacked astrocomb lines (Eq. (10)). The thick red line is the empirical IP model, ψ(x) in the first iteration. The model was derived by performing a GP regression on the black points (Sect. 2.4) with a secondary GP for variance estimation. The dashed blue line is the mean function of the GP, Eq. (17). The numbers to the right of the panel give additional information. The first seven numbers are the values of the parameters (θ, ϕ, σ0) that minimise the loss function, − log 𝓛, where 𝓛 is the model likelihood (also quoted). N and v are the number of data points and the number of degrees of freedom in the fit, respectively. χ2 is given by Equation (22) and ![]() . The final number specifies the shift applied to Δx to ensure proper centring, Eq. (20). Second panel: The black points show the difference between the data and the GP mean function (a Gaussian with parameters θ = {A,µ, σ, y0}). The red line shows ψ(x) − m(x), i.e. departures from the Gaussian shape. Third panel: Grey dots are the variances on the
. The final number specifies the shift applied to Δx to ensure proper centring, Eq. (20). Second panel: The black points show the difference between the data and the GP mean function (a Gaussian with parameters θ = {A,µ, σ, y0}). The red line shows ψ(x) − m(x), i.e. departures from the Gaussian shape. Third panel: Grey dots are the variances on the ![]() , i.e. Eq. (11). Orange points and bands are the variances inferred from the data (as per Eq. (24)) and the corresponding uncertainty. The larger black dots are the sum of modified ∈data and σ0. The red line is the variance of the GP model, i.e. the diagonal of Ki,j, Equation (18). Fourth panel: The grey dots show the normalised residuals. The grey shaded area shows the ±1σ range and the dashed black lines show the 5th and 95th percentiles. The small panel to the right shows the histogram of the residuals. The shaded area and the dashed lines are the same as in the panel immediately to the left. The number in the top right corner of the panel is the median, and the upper and lower limits correspond to the 5th and 95th percentiles.
, i.e. Eq. (11). Orange points and bands are the variances inferred from the data (as per Eq. (24)) and the corresponding uncertainty. The larger black dots are the sum of modified ∈data and σ0. The red line is the variance of the GP model, i.e. the diagonal of Ki,j, Equation (18). Fourth panel: The grey dots show the normalised residuals. The grey shaded area shows the ±1σ range and the dashed black lines show the 5th and 95th percentiles. The small panel to the right shows the histogram of the residuals. The shaded area and the dashed lines are the same as in the panel immediately to the left. The number in the top right corner of the panel is the median, and the upper and lower limits correspond to the 5th and 95th percentiles.
Current usage metrics show cumulative count of Article Views (full-text article views including HTML views, PDF and ePub downloads, according to the available data) and Abstracts Views on Vision4Press platform.
Data correspond to usage on the plateform after 2015. The current usage metrics is available 48-96 hours after online publication and is updated daily on week days.
Initial download of the metrics may take a while.