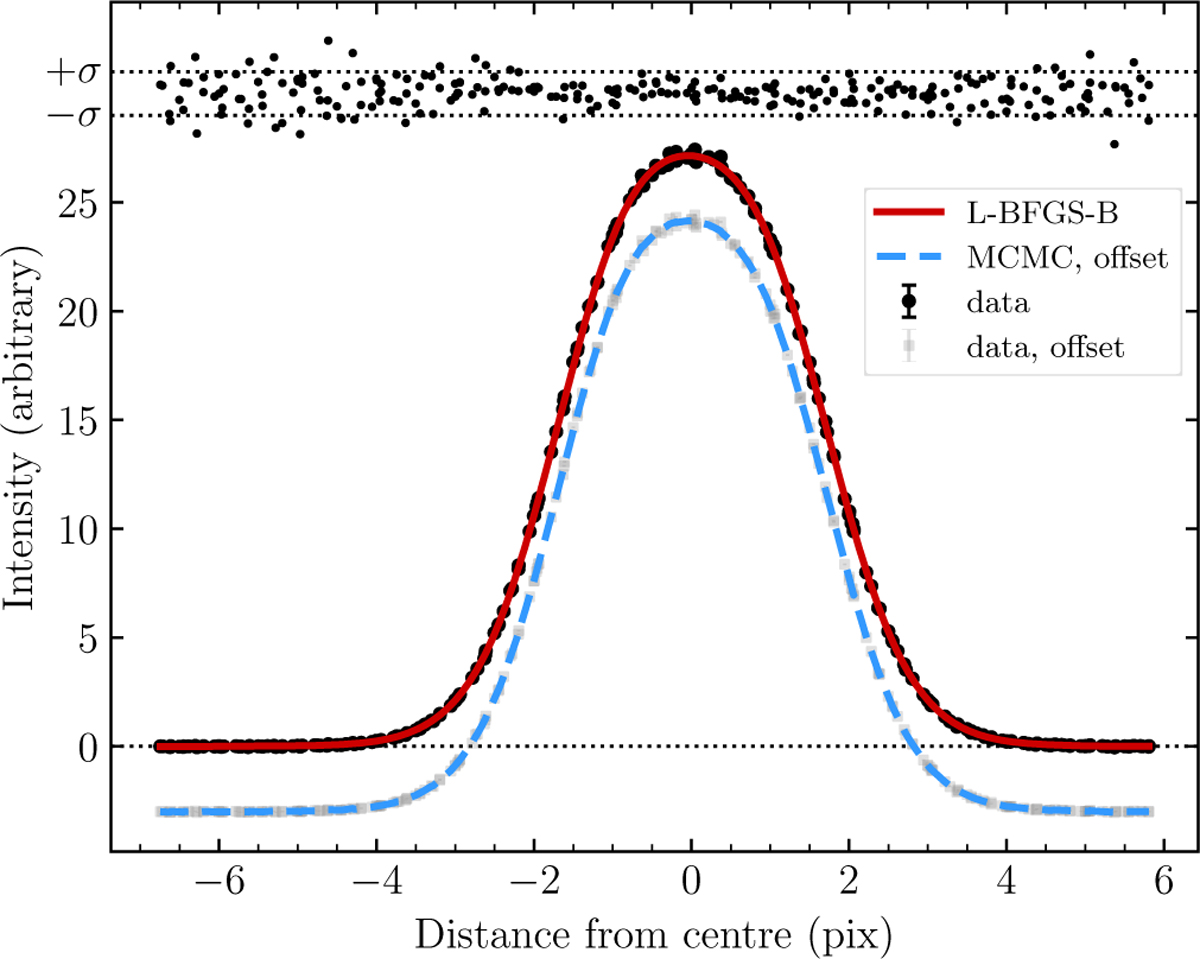
Fig. B.2
Download original image
Comparison between IP models derived in two different ways. The model derived using the L-BFGS-B is shown as a solid red line (overlaid on top of black points) and the MCMC derived model is shown as a dashed blue line (overlaid on top of grey points). The two IP models are indistinguishable from one another. The two sets of lines and data points have been offset by 3 in y direction for clarity. The normalised residuals between the two models, that is the MCMC model minus the L-BFGS-B model divided by the error on the data, are shown as black dots at the top of the panel. The two dotted horizontal lines bracketing the residuals indicate ±lσ, where σ is the error on the data.
Current usage metrics show cumulative count of Article Views (full-text article views including HTML views, PDF and ePub downloads, according to the available data) and Abstracts Views on Vision4Press platform.
Data correspond to usage on the plateform after 2015. The current usage metrics is available 48-96 hours after online publication and is updated daily on week days.
Initial download of the metrics may take a while.