Fig. B.1
Download original image
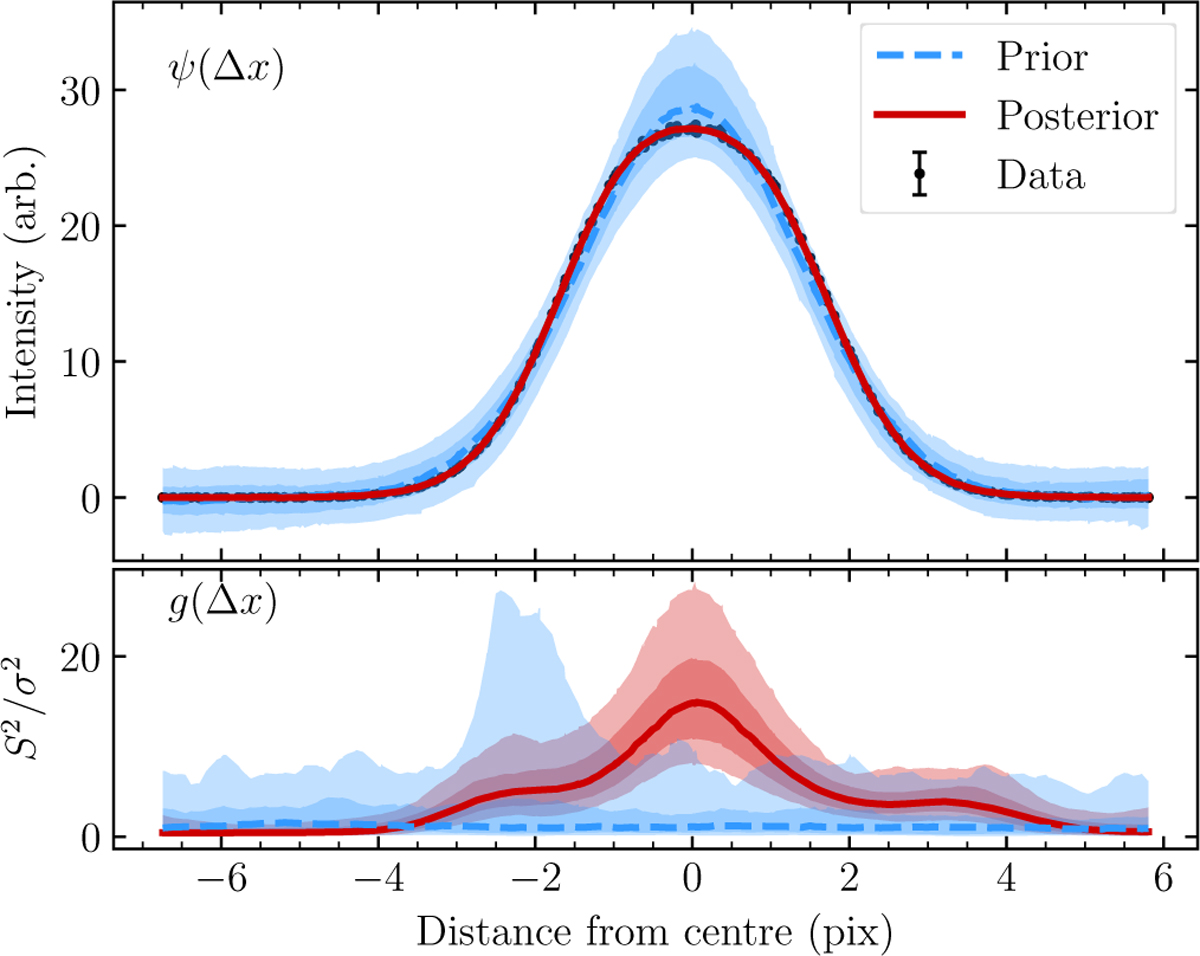
Prior and posterior distributions for ψ(Δx) and g(∆x). Top panel: The data correspond to the tenth segment of order 110. The dashed blue line is the median of the prior distribution for ψ(∆x). The blue shaded bands around the blue line show the central 68% and 95% of the prior distribution. The red solid line and the corresponding red bands show the same quantities for the posterior distribution. Bottom panel: The lines and the bands have the same meaning as in the top panel but are for function g(∆x) which modifies the variance array as per Eq. (24).
Current usage metrics show cumulative count of Article Views (full-text article views including HTML views, PDF and ePub downloads, according to the available data) and Abstracts Views on Vision4Press platform.
Data correspond to usage on the plateform after 2015. The current usage metrics is available 48-96 hours after online publication and is updated daily on week days.
Initial download of the metrics may take a while.