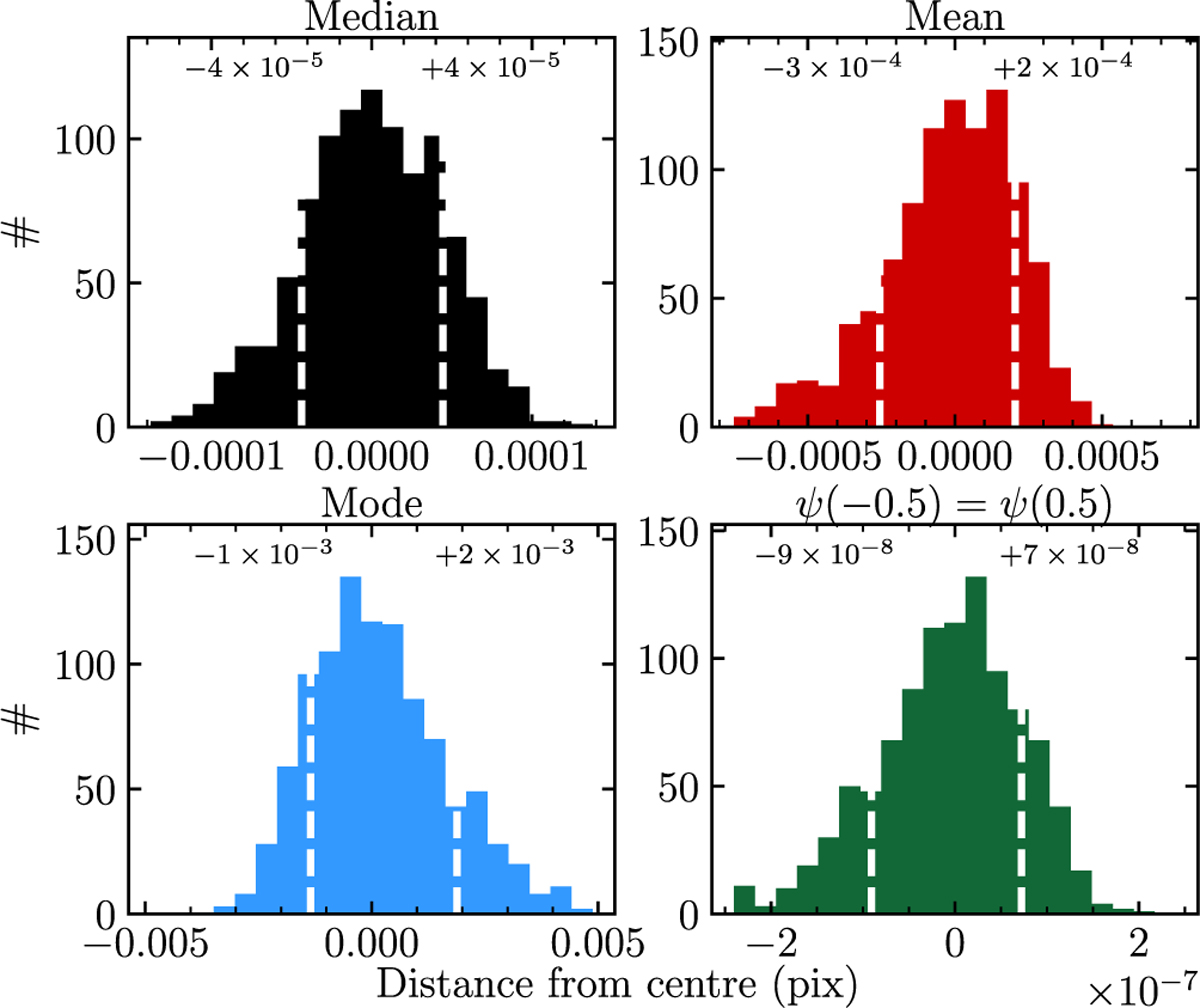
Fig. A.2
Download original image
Distribution of ‘centre’ measurements for the 1000 instrumental profiles shown in Fig. A.1, where the centre estimator used is indicated at the top of the panel. Since we were interested in quantifying the stability (distribution width) of each centre estimator under small perturbations of the IP, the distributions plotted were shifted to have zero median. The dashed white vertical lines show the limits of the central 68% of the distribution and the text above the lines gives their values in units pixel. Ranking centre estimators from the most stable to the least stable, we get: ψ(−0. 5) = ψ(0. 5), the median, the mean, and the mode.
Current usage metrics show cumulative count of Article Views (full-text article views including HTML views, PDF and ePub downloads, according to the available data) and Abstracts Views on Vision4Press platform.
Data correspond to usage on the plateform after 2015. The current usage metrics is available 48-96 hours after online publication and is updated daily on week days.
Initial download of the metrics may take a while.