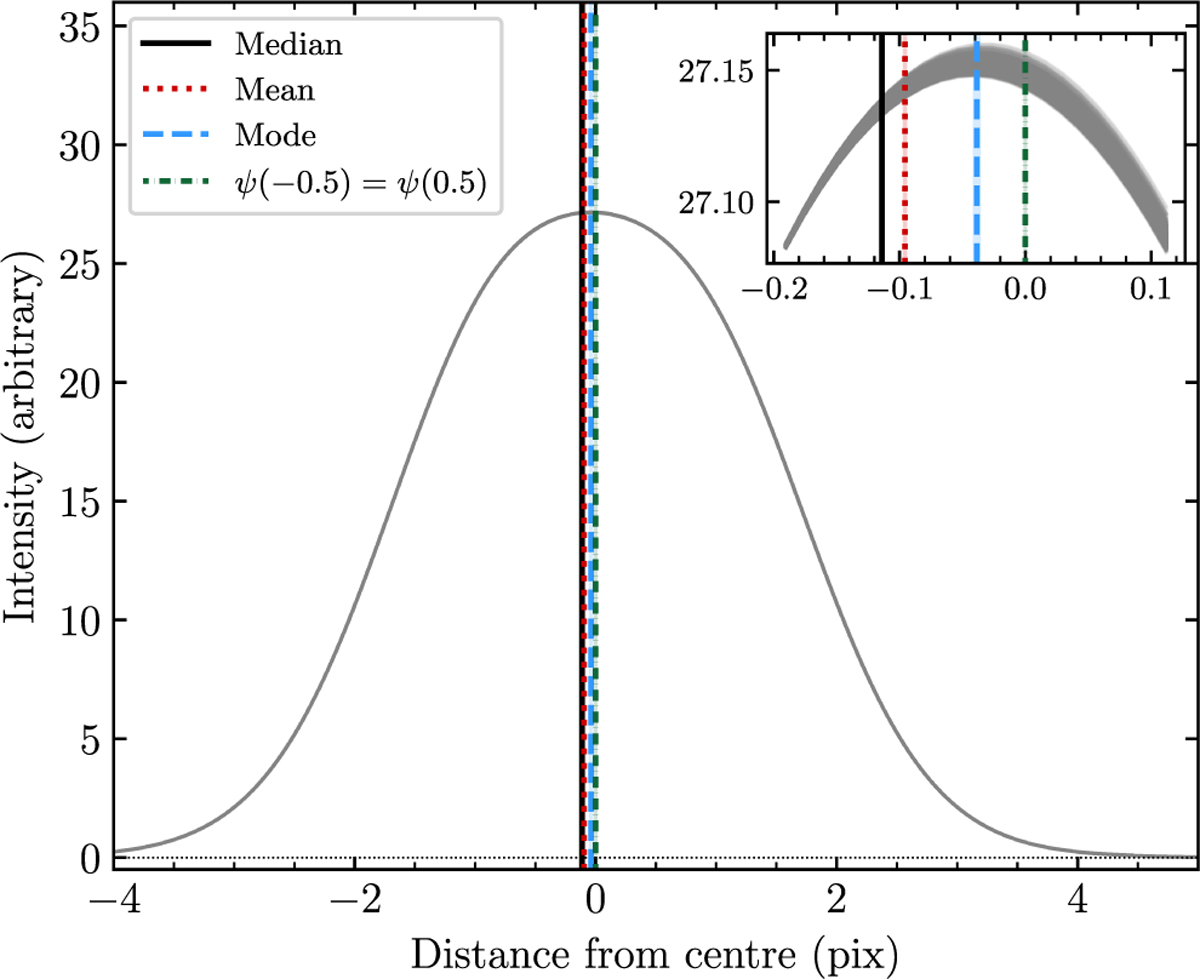
Fig. A.1
Download original image
Set of 1000 MCMC HARPS instrumental profiles, trained on the data and shown on a fine grid. For each profile, we calculated the median, the mean, the mode, and the location satisfying ψ(−0.5) = ψ(0.5), producing distributions for each of the four quantities. The means of the four distributions is shown as a vertical line of different colour and stroke. The x-axis zero point is set to the mean of the distribution for ψ(−0.5) = ψ(0.5) centres. The inset on the top right shows a zoom-in of the region around the profile peak. Units in the inset are the same as in the main panel.
Current usage metrics show cumulative count of Article Views (full-text article views including HTML views, PDF and ePub downloads, according to the available data) and Abstracts Views on Vision4Press platform.
Data correspond to usage on the plateform after 2015. The current usage metrics is available 48-96 hours after online publication and is updated daily on week days.
Initial download of the metrics may take a while.