Fig. 16
Download original image
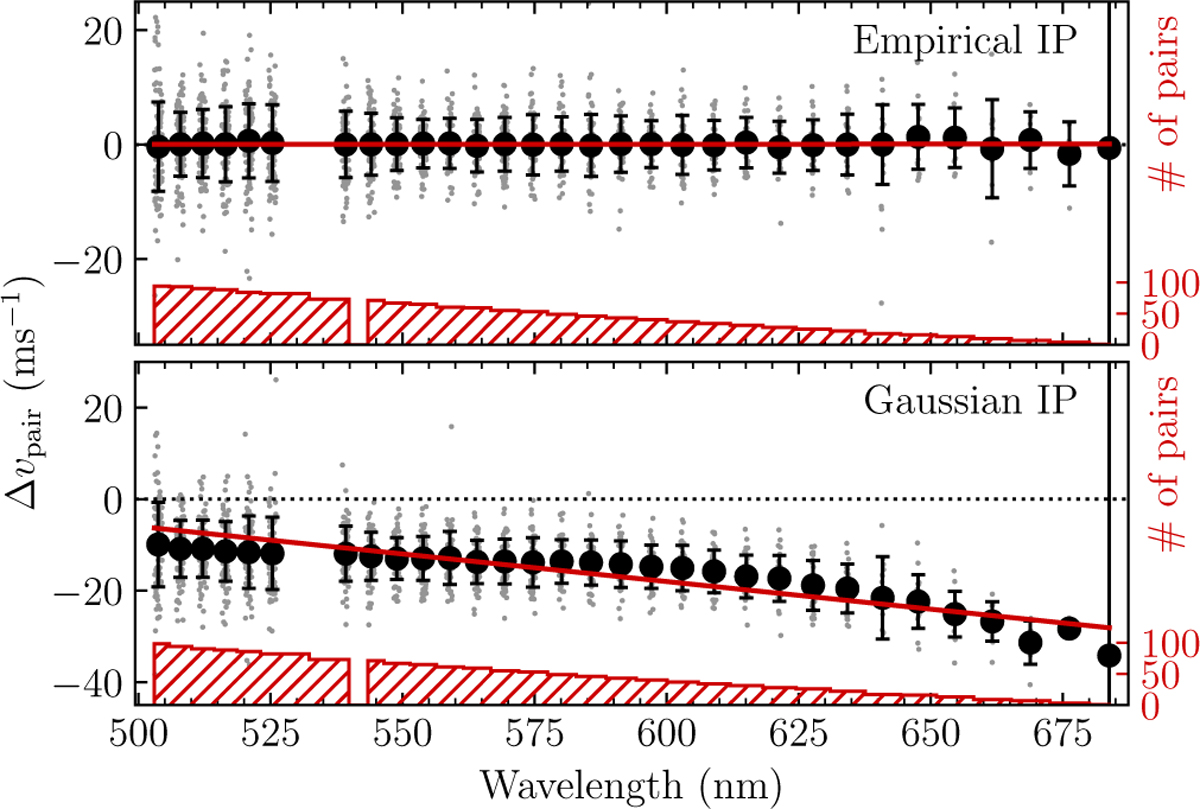
Dependence of Δvpair on wavelength when our empirical IPs are used (top panel) and when Gaussian IPs are used (bottom panel). Small grey dots are the 1472 Δvpair values and large black dots with error bars are the means and the standard deviations calculated over binned values. Bin edges were determined such that a single bin contain all astrocomb lines appearing in the same echelle order. In calculating the above quantities, we ignored values falling outside of ±20 m s−1 (±50 m s−1) for the empirical (Gaussian) IP cases. The red line in each panel is the best-fit straight line going through the binned values (see text for parameter values). The red hashed histogram and the red labels on the right spine of the figure show the number of grey dots falling in each bin. The bin at λ = 687 nm contains a single point.
Current usage metrics show cumulative count of Article Views (full-text article views including HTML views, PDF and ePub downloads, according to the available data) and Abstracts Views on Vision4Press platform.
Data correspond to usage on the plateform after 2015. The current usage metrics is available 48-96 hours after online publication and is updated daily on week days.
Initial download of the metrics may take a while.