Fig. 15
Download original image
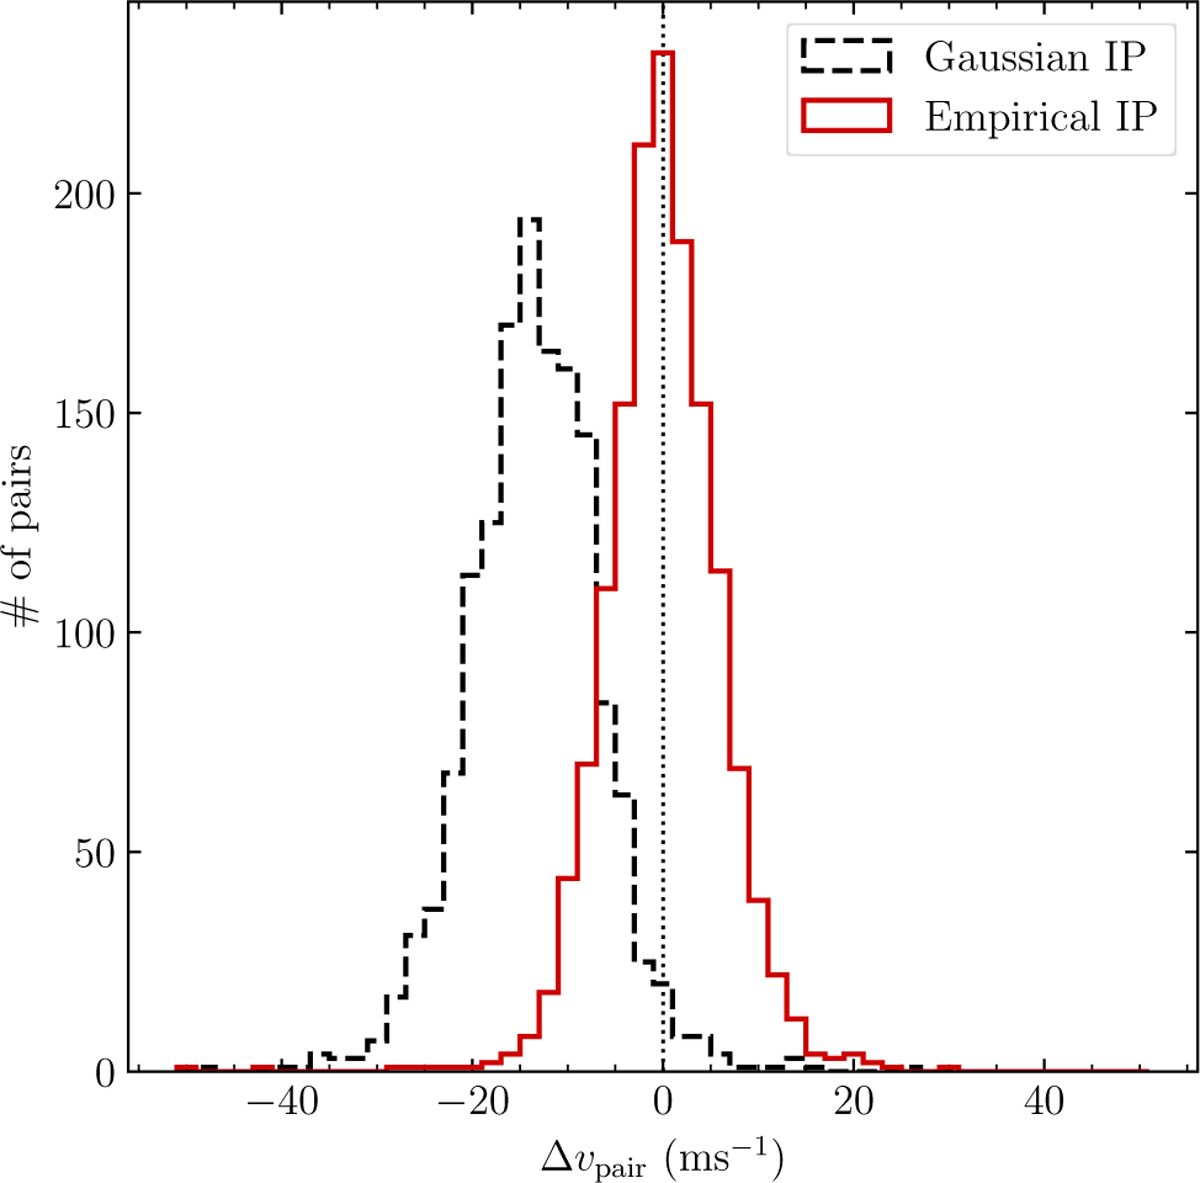
Histogram of measured velocity shifts (Eq. (28)) between 1472 astrocomb modes appearing twice in the spectrum. Line wavelengths were measured by fitting the most likely empirical IP model (full red histogram) or a Gaussian IP model (dashed black histogram) to the data in a wavelength calibrated spectrum. Zero velocity means that the same wavelength was measured for both lines of the pair.
Current usage metrics show cumulative count of Article Views (full-text article views including HTML views, PDF and ePub downloads, according to the available data) and Abstracts Views on Vision4Press platform.
Data correspond to usage on the plateform after 2015. The current usage metrics is available 48-96 hours after online publication and is updated daily on week days.
Initial download of the metrics may take a while.