Fig. 14
Download original image
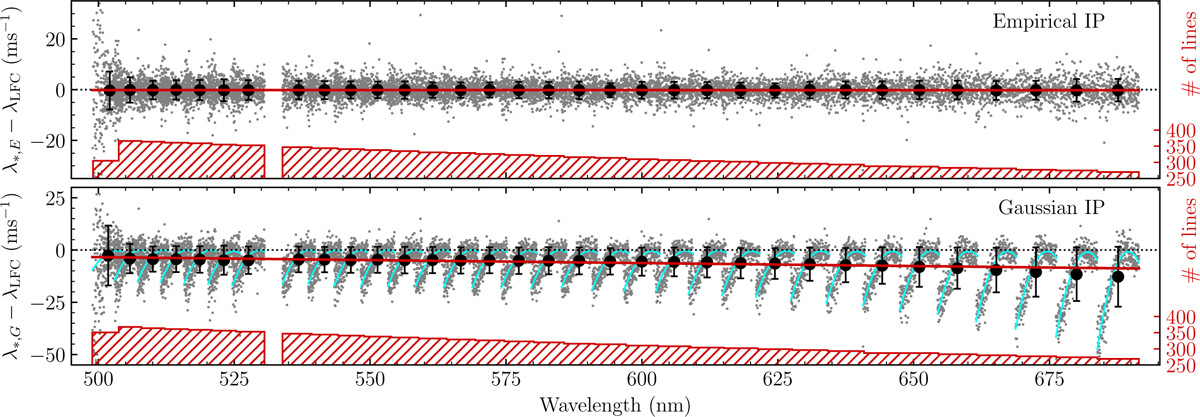
Wavelength measurement error, ∈λ, as a function of wavelength for our empirical IP models (top) and for the Gaussian IP approximation (bottom). Grey dots are the same 10 576 error values shown in Fig. 13, but now plotted as a function of λLFC The data were binned such that each bin contains all astrocomb lines appearing in the same echelle order, after which the mean and standard deviation were calculated for each bin (black dots with error bars). In calculating the above quantities, we ignored values falling outside of ±20 m s−1 (±50 m s−1) for the empirical (Gaussian) IP cases. The red line in each panel is the best-fit straight line going through the binned values (see text for parameter values). The red hashed histogram and the red labels on the right spine of the figure show the number of grey dots falling in each bin. Note that the bin edges are approximate because of the partial overlap between spectral ranges of adjacent orders. Thin cyan lines in the bottom panel are the best fit second order polynomials to the grey dots. Their parameters are tabulated in Table E.1.
Current usage metrics show cumulative count of Article Views (full-text article views including HTML views, PDF and ePub downloads, according to the available data) and Abstracts Views on Vision4Press platform.
Data correspond to usage on the plateform after 2015. The current usage metrics is available 48-96 hours after online publication and is updated daily on week days.
Initial download of the metrics may take a while.