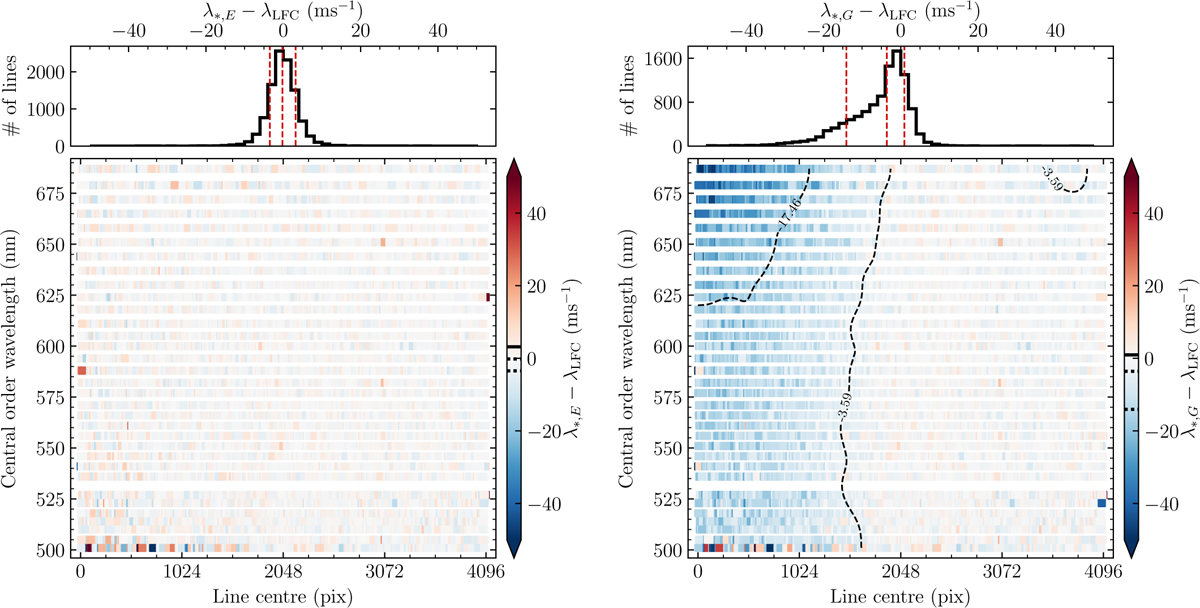
Fig. 13
Download original image
Wavelength measurement error, ∈λ, as a function of detector position for our empirical IP models (left) and for the Gaussian IP approximation (right). Colour schemes in both panels are identical and centred at 0 m s−1 (white) to highlight the vast improvements associated with the former. Contours for the empirical IP case (left) were not informative so are not shown. Plotted contour levels for the Gaussian IP case (right) correspond to the 16th and 50th value percentiles (−14.06 m s−1 and −3.59 m s−1, respectively) while values above the 68th percentile (i.e. above 0.93 m s−1) do not cluster at any specific location so that contour is not shown. Smaller panels show the histogram of values shown under them. The median and the central 68% distribution limits are shown as vertical dashed red lines. The same quantities are shown as thick black lines in the colour bar to the right of each main panel.
Current usage metrics show cumulative count of Article Views (full-text article views including HTML views, PDF and ePub downloads, according to the available data) and Abstracts Views on Vision4Press platform.
Data correspond to usage on the plateform after 2015. The current usage metrics is available 48-96 hours after online publication and is updated daily on week days.
Initial download of the metrics may take a while.