Fig. 10
Download original image
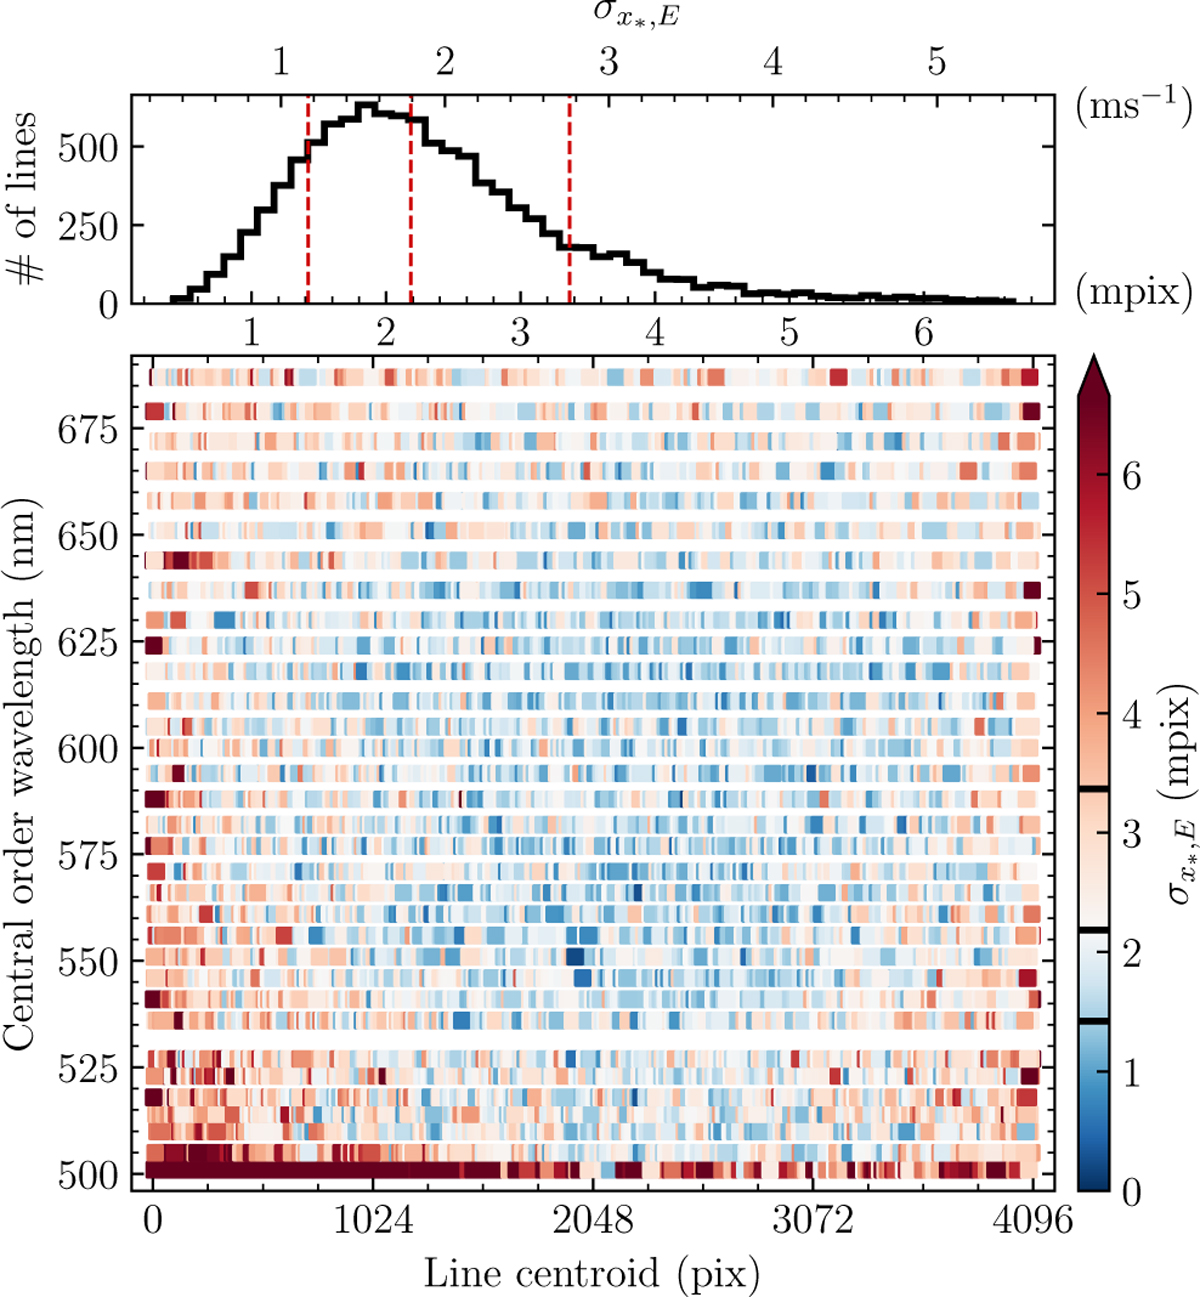
Uncertainty on astrocomb line centres from fitting our empirical IP models to the data, ![]() . Main panel:
. Main panel: ![]() as a function of position on the detector. The colour bar zero point is set to the sample median, such that the red and the blue colours correspond to values larger and smaller than the median, respectively. Lines with larger uncertainties generally have larger
as a function of position on the detector. The colour bar zero point is set to the sample median, such that the red and the blue colours correspond to values larger and smaller than the median, respectively. Lines with larger uncertainties generally have larger ![]() (cſ. Fig. 9) or low S/N (at 500 nm). Top panel: Histogram of the values plotted in the main panel. The vertical dashed red lines show the median and the central 68% distribution limits, which are also shown as thick black horizontal lines in the colour bar. The x-axis on the top shows
(cſ. Fig. 9) or low S/N (at 500 nm). Top panel: Histogram of the values plotted in the main panel. The vertical dashed red lines show the median and the central 68% distribution limits, which are also shown as thick black horizontal lines in the colour bar. The x-axis on the top shows ![]() in units m s−1 (1 pix = 820m s−1).
in units m s−1 (1 pix = 820m s−1).
Current usage metrics show cumulative count of Article Views (full-text article views including HTML views, PDF and ePub downloads, according to the available data) and Abstracts Views on Vision4Press platform.
Data correspond to usage on the plateform after 2015. The current usage metrics is available 48-96 hours after online publication and is updated daily on week days.
Initial download of the metrics may take a while.