Fig. 1
Download original image
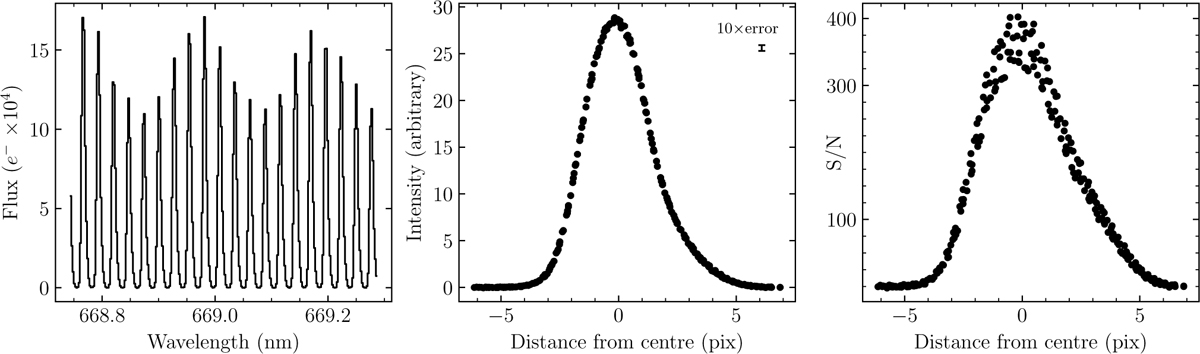
Basic principles of IP reconstruction methods used in this work. Left panel: the extracted astrocomb spectrum observed by HARPS in the wavelength range 668.8 nm ⩽ λ ⩽ 669.3 nm containing 20 astrocomb modes, blaze-corrected and background-subtracted. Middle panel: the same lines as in the left panel, flux normalised and stacked on their best-fit Gaussian centres (see Sect. 3.1). The result is a remarkably well-sampled representation of the 1d IP in this wavelength range with 256 points. The sub-pixel sampling was achieved due to the IP falling slightly differently with respect to the pixel centre for each line. The right-skewed asymmetry in the IP shape is immediately noticeable. The error bar in the top right corner shows ten times the median error on individual points (enlarged for visibility). Right panel: Individual points reach an S/N of several hundred across a large fraction of the HARPS wavelength range.
Current usage metrics show cumulative count of Article Views (full-text article views including HTML views, PDF and ePub downloads, according to the available data) and Abstracts Views on Vision4Press platform.
Data correspond to usage on the plateform after 2015. The current usage metrics is available 48-96 hours after online publication and is updated daily on week days.
Initial download of the metrics may take a while.