Fig. 5
Download original image
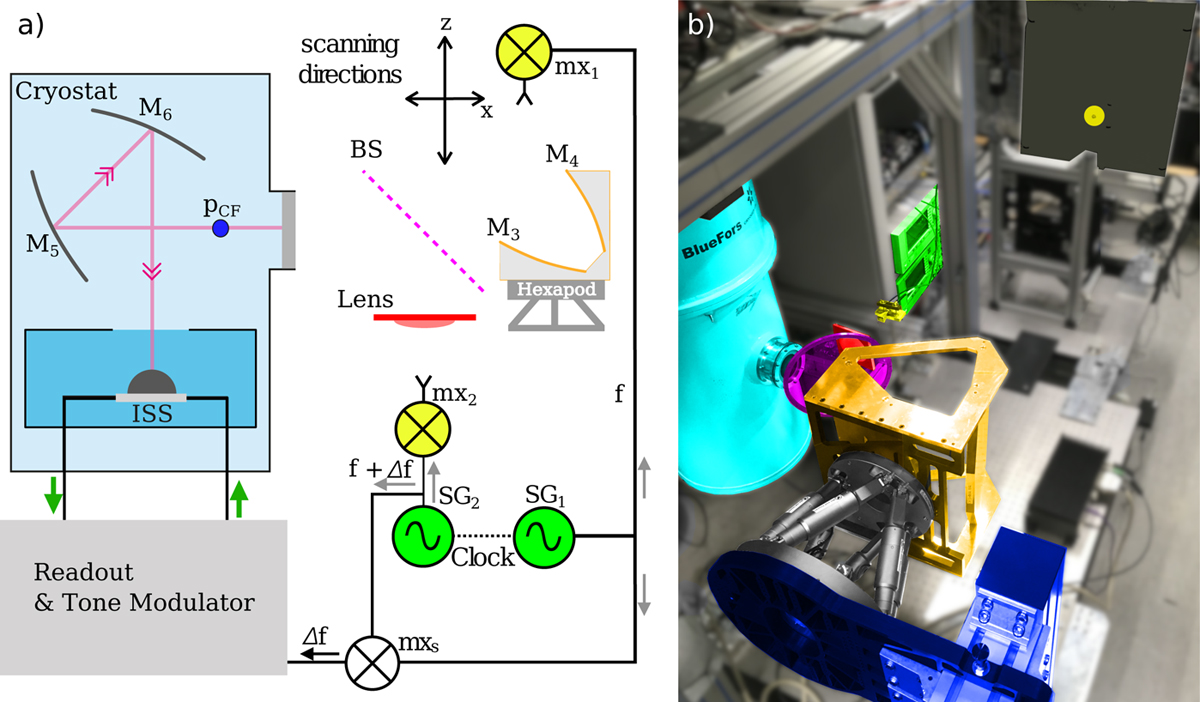
Overview of the HPA measurement setup around the warm focal plane, (a) Sketch of the HPA measurement setup around the warm focal plane. The sketch is similar to the sketch in Fig. 2a, the only difference is the addition of the warm optics and hexapod and a change in the scanning directions resulting from the positioning of mx1. (b) Photograph of the laboratory setup, with the scanning plane after the warm optics. The laboratory setup is essentially the same as Fig. 2b, except for the addition of the warm optics, which is shown in orange. The signal generators are also visible now. The −90° rotation is around the optical axis out of the cryostat window with respect to the optical configuration shown in Fig. 2b. The laboratory photograph has the same colour-coding as the sketch in (a). Because the optical axis from the warm optics is now oriented along the y-axis, the scanning plane is now oriented along the x- and z-axes. This is also reflected in panel a.
Current usage metrics show cumulative count of Article Views (full-text article views including HTML views, PDF and ePub downloads, according to the available data) and Abstracts Views on Vision4Press platform.
Data correspond to usage on the plateform after 2015. The current usage metrics is available 48-96 hours after online publication and is updated daily on week days.
Initial download of the metrics may take a while.