Fig. 4
Download original image
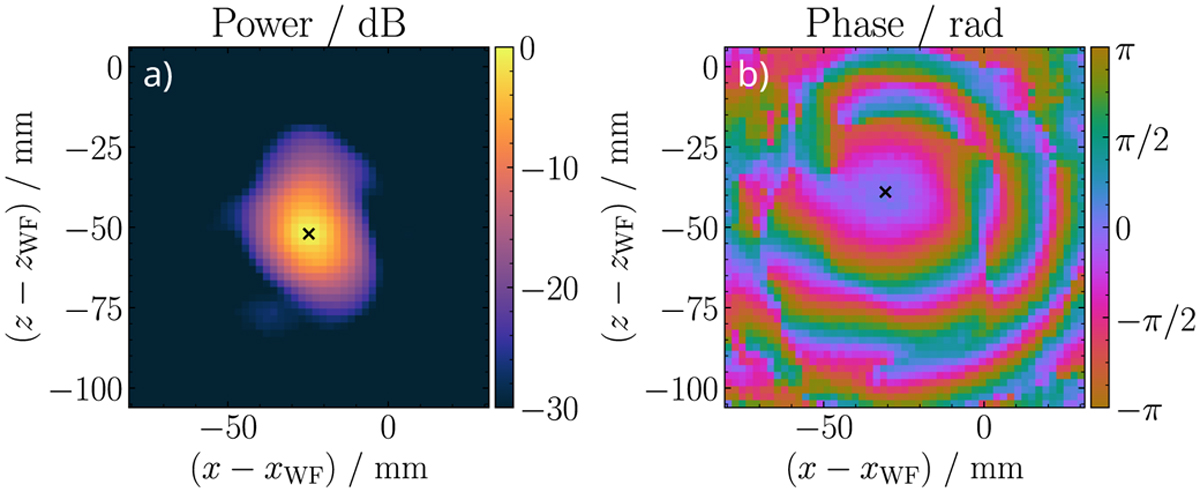
Complex beam patterns at 205 GHz as measured with the HPA technique after the warm focal plane, with the hexapod in home configuration, (a) Amplitude pattern, (b) Phase pattern. The coordinates are with respect to the warm focus. Because they were measured in the laboratory using the setup in Fig. 5b, we used the scanning plane axes as shown in Fig. 5a, with the warm focus in the xz-plane. We denote the amplitude and phase centres with black crosses. They are different, which indicates that the beam is tilted with respect to the scanning plane normal.
Current usage metrics show cumulative count of Article Views (full-text article views including HTML views, PDF and ePub downloads, according to the available data) and Abstracts Views on Vision4Press platform.
Data correspond to usage on the plateform after 2015. The current usage metrics is available 48-96 hours after online publication and is updated daily on week days.
Initial download of the metrics may take a while.