Fig. 3
Download original image
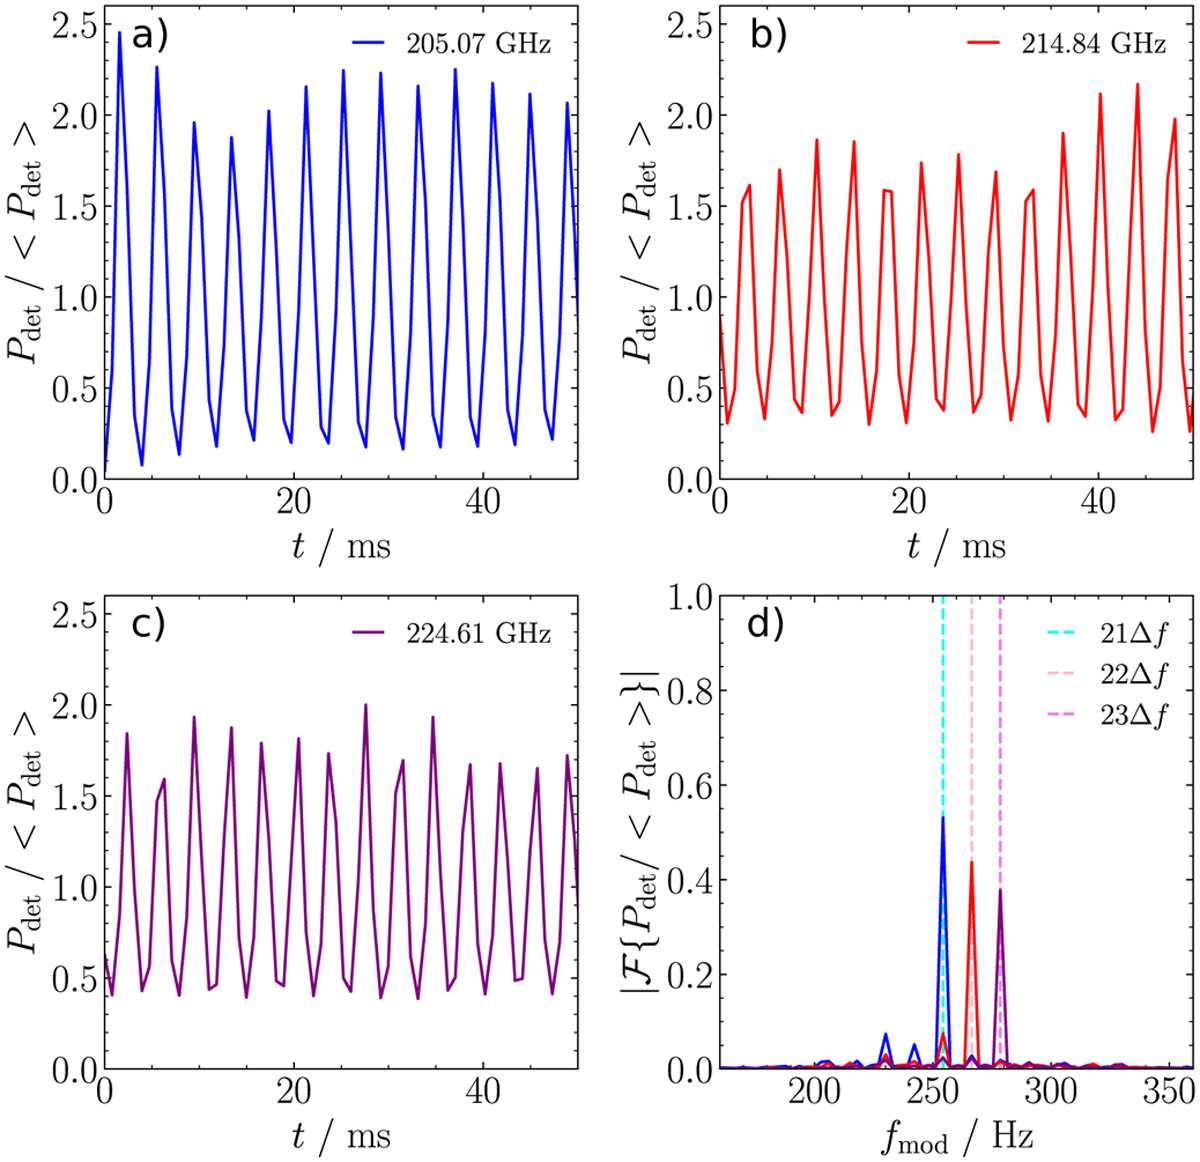
Demonstration of the temporal modulation of Pdet as recorded during an HPA measurement. All Pdet were measured with the scanning plane centred on the beam from the ISS. (a) Raw time-stream data for Pdet of MKID 171 at 205.07 GHz. We normalised to the time-averaged power < Pdet > entering the MKID. We plot the data for a time range of 50 ms. The modulation at n∆f is visible as the rapid oscillation of the time-stream data, which has a period of about 3.9 ms. (b) Raw time-stream of MKID 96 at 214.84 GHz. (c) Raw time-stream of MKID 47 at 224.61 GHz. (d) Magnitude of the Fourier transforms of the signals in panels a, b, and c. The abscissa represents the frequencies present in the time-modulation of Pdet and is denoted by ƒmod. The dashed vertical cyan line represents the n∆f for nf0 = 205.07 GHz. Given the value of ƒ0, this corresponds to n = 21 and thus n∆f = 254.31 Hz, which is where we would expect the peak. The dashed pink line corresponds to n = 22 for nf0 = 214.84 GHz, and the dashed violet line shows n = 23, nf0 = 224.61 GHz.
Current usage metrics show cumulative count of Article Views (full-text article views including HTML views, PDF and ePub downloads, according to the available data) and Abstracts Views on Vision4Press platform.
Data correspond to usage on the plateform after 2015. The current usage metrics is available 48-96 hours after online publication and is updated daily on week days.
Initial download of the metrics may take a while.