Fig. 2
Download original image
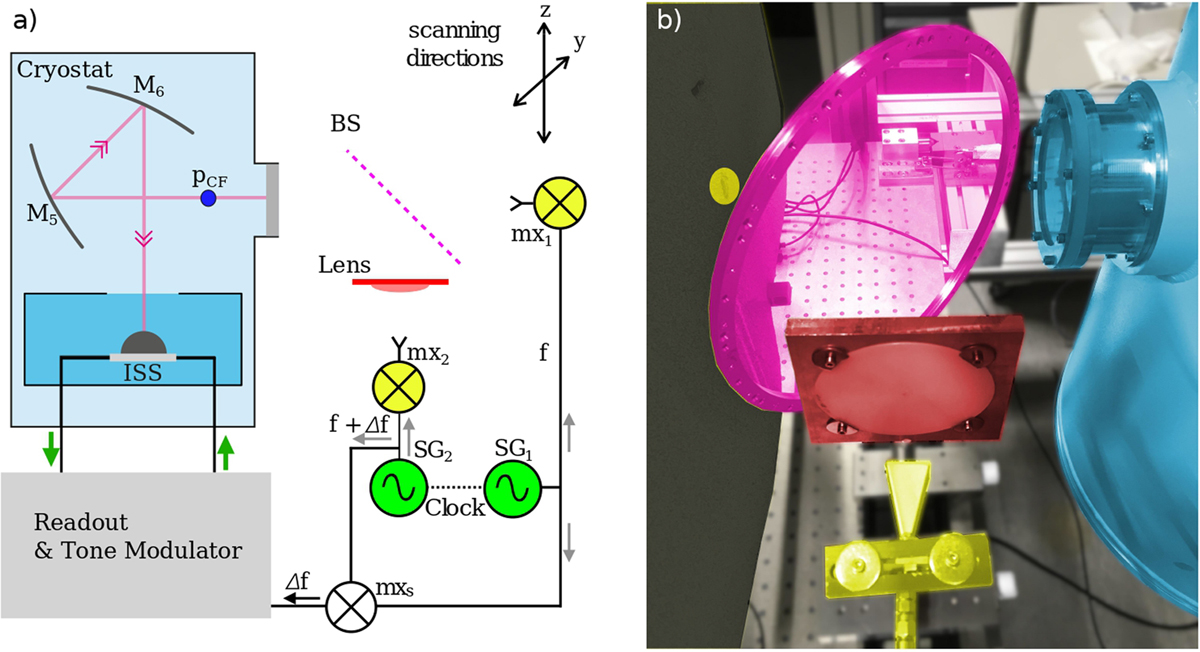
Overview of the HPA measurement setup in front of the cryostat window, (a) Sketch of the cryostat and HPA measurement setup. In green, we plot the two signal generators SG1 and SG2. The harmonic mixers are depicted in yellow. The beam splitter, shown in pink and denoted BS, is situated such that its faces are illuminated by both mx1 and mx2. A lens, depicted in red, is placed in between mx2 and the beam splitter to increase the coupling. The modulated signal Um then travels through the cryostat to the ISS. (b) Photograph of the HPA measurement setup in front of the cryostat window. The components are colour-coded in the same fashion as in panel a. The mixer mx1 is located inside the yellow disk on the left. The material in which mx1 is embedded is a sheet of radiation-absorbing material. This prevents standing waves from generating in between mx1 and the cryostat window. In this photograph, the x-axis depicted in Fig. 1a points out of the cryostat window into the beam splitter and scanning plane. The scanning plane is oriented along the z- and y-axes. The diagonal horn containing mx2 is also shown in yellow and is visible at the bottom of the image, below the lens, which is shown in red.
Current usage metrics show cumulative count of Article Views (full-text article views including HTML views, PDF and ePub downloads, according to the available data) and Abstracts Views on Vision4Press platform.
Data correspond to usage on the plateform after 2015. The current usage metrics is available 48-96 hours after online publication and is updated daily on week days.
Initial download of the metrics may take a while.