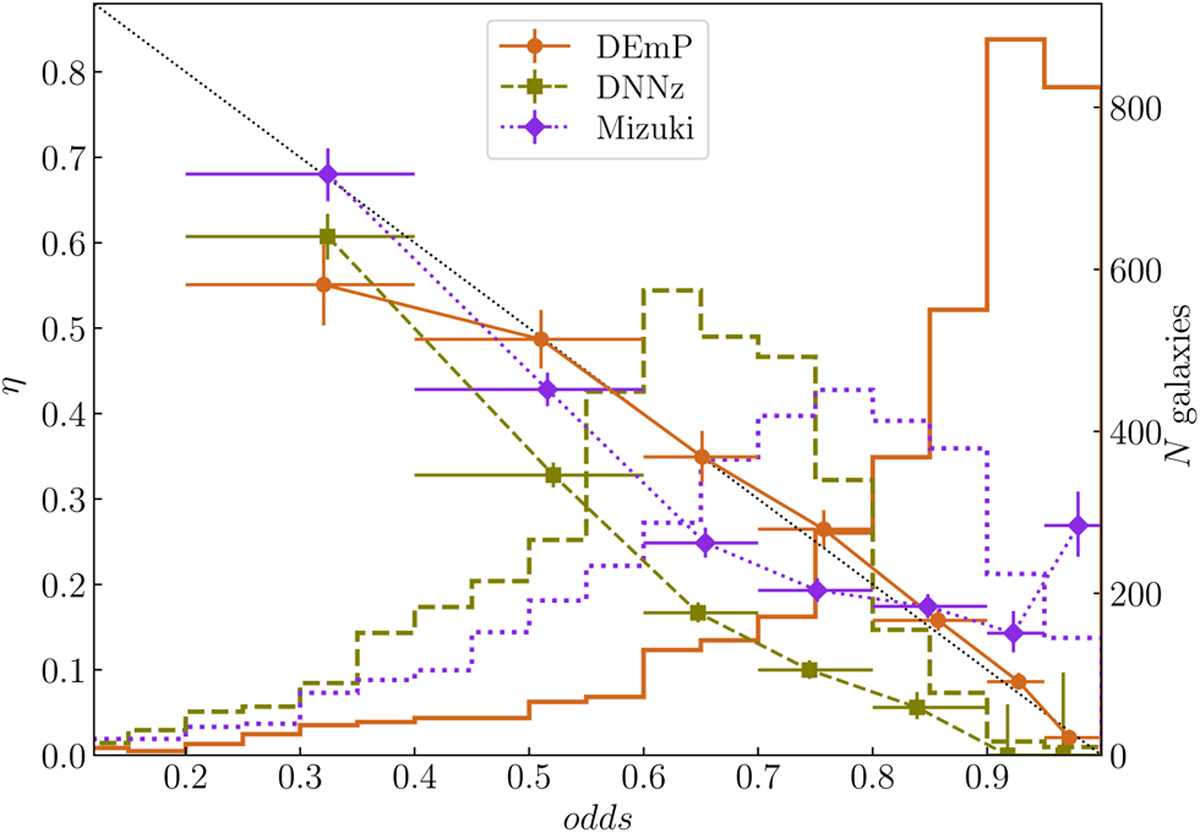
Fig. 5

Download original image
Outlier rate as a function of the odds parameter (symbols with error bars) and distribution of odds values (open histograms, scale on the right axis) for photo-z obtained with each of the photo-z codes used by HSC-SSP. Horizontal error bars represent the intervals in which η is calculated. Vertical error bars indicate 68% confidence intervals for η estimated with the Wilson (1927) formula for binomial distributions. The dotted diagonal line represents the expected relation between η and odds for realistic PDZs.
Current usage metrics show cumulative count of Article Views (full-text article views including HTML views, PDF and ePub downloads, according to the available data) and Abstracts Views on Vision4Press platform.
Data correspond to usage on the plateform after 2015. The current usage metrics is available 48-96 hours after online publication and is updated daily on week days.
Initial download of the metrics may take a while.


