Fig. 1

Download original image
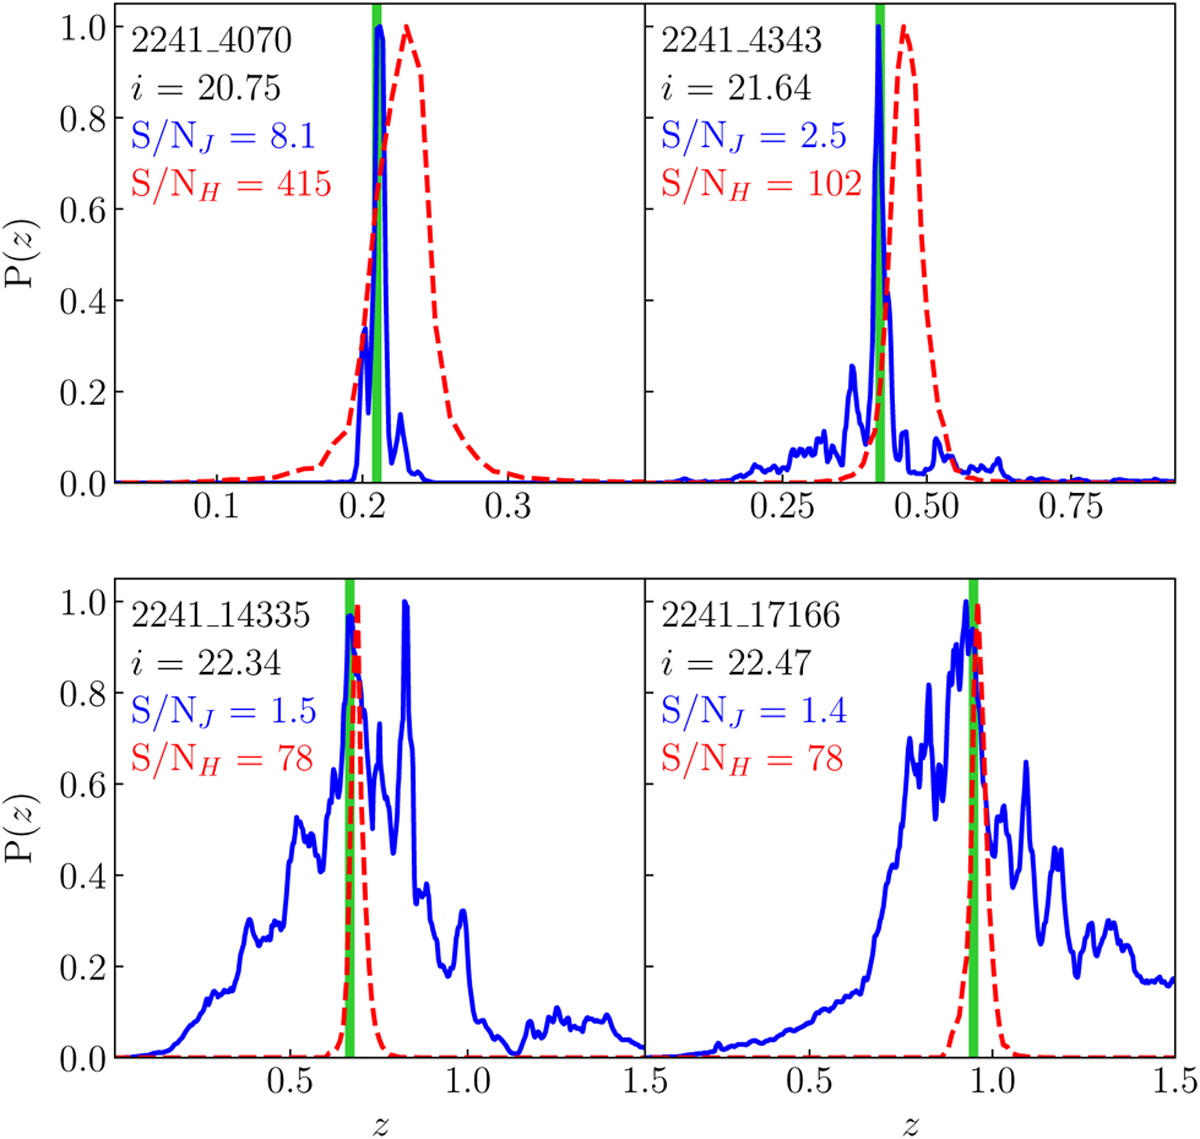
Comparison of redshift probability distributions obtained from narrow-band J-PAS photometry (blue solid line) and deep broad-band photometry from HSC-SSP (red dashed line) in four galaxies from the AEGIS field sample. The spectroscopic redshift is marked with a green vertical line. Annotations in the top left corner of each panel indicate (from top to bottom) the source ID in the miniJPAS public data release catalogue, its i-band magnitude, and the median S/N per band in the J-PAS photometry and the HSC-SSP photometry.
Current usage metrics show cumulative count of Article Views (full-text article views including HTML views, PDF and ePub downloads, according to the available data) and Abstracts Views on Vision4Press platform.
Data correspond to usage on the plateform after 2015. The current usage metrics is available 48-96 hours after online publication and is updated daily on week days.
Initial download of the metrics may take a while.


