Fig. 5

Download original image
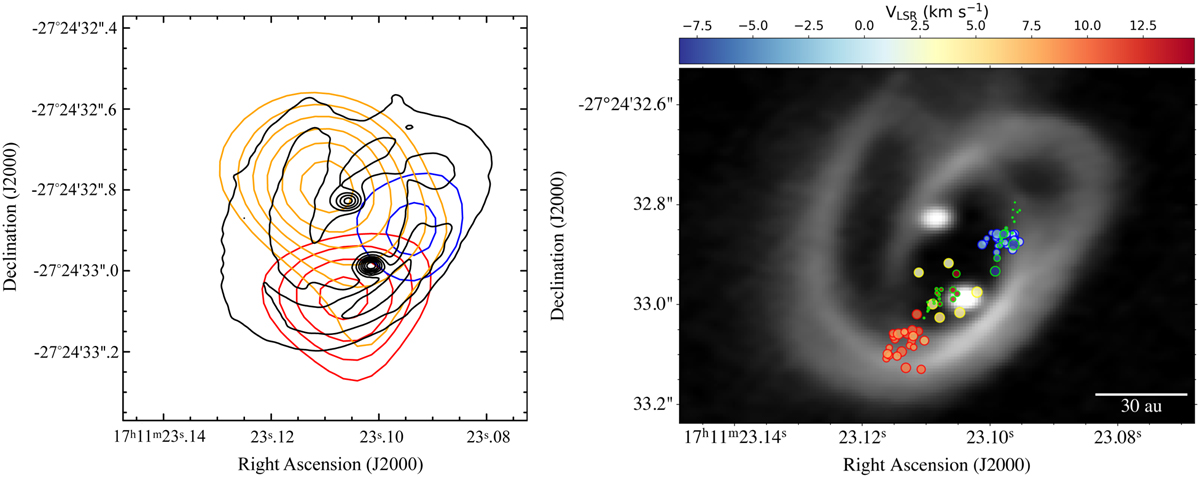
Analysis of the origin of the observed dimethyl ether components. Left: contour map emission at 258.549 GHz for the two most extreme velocities detected at 3σ at the −3.69 km s−1 channel (blue) and at the 11.86 km s−1 channel (red), as well as the central peak channel at 2.8 km s−1 (orange). The contours start at 4σ every 1σ. The dust continuum map from Alves et al. (2019) is superposed in black. Right: position of intensity peaks (circles) from the 2D Gaussian fit of the emission of the CH3OCH3 line transition at 258.549 GHz in each velocity channel separated by ∼ 0.14 km s−1 plotted over the dust continuum map of Alves et al. (2019). The colour code for the edges of the circle is red for the 9.2 km s−1 CH3OCH3 component (>6 km s−1), yellow for the 3 km s−1 CH3OCH3 component (]1,6[ km s−1 ), and blue for the −1.9 km s−1 CH3OCH3 component (<1 km s−1), while the CO (2−1) high-velocity components are shown in bright green. The circle size is defined by the uncertainty on the absolute position of the emission peak in each velocity component (the largest circle has ∼ 0.02″ given by θ/(2 × S/N), as explained in the text of Sect. 4).
Current usage metrics show cumulative count of Article Views (full-text article views including HTML views, PDF and ePub downloads, according to the available data) and Abstracts Views on Vision4Press platform.
Data correspond to usage on the plateform after 2015. The current usage metrics is available 48-96 hours after online publication and is updated daily on week days.
Initial download of the metrics may take a while.


