Fig. A.3.
Download original image
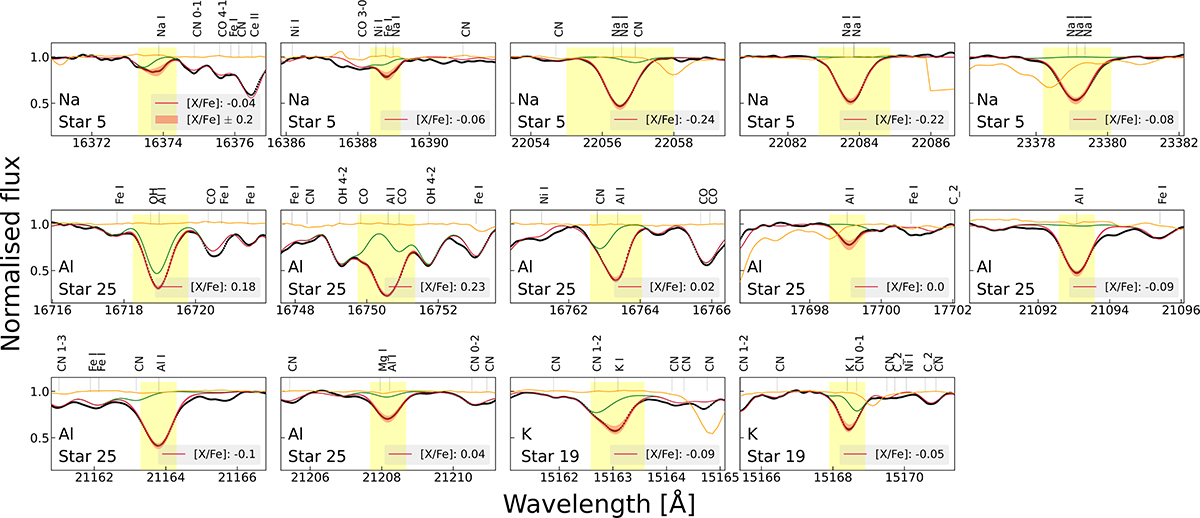
Odd-Z elements. The wavelength regions are centered at the five selected sodium lines (we note that only the two H-band lines were used to estimate the mean [Na/Fe] in Figure 6) for the star 2M06052796-0553384 (star 5), at the seven selected aluminum lines for the star 2M14275833-6147534 (star 25), and at the two selected potassium lines for the star 2M13403516-5040261 (star 19). Arrangement of figures and plot descriptions are similar to Figure A.1.
Current usage metrics show cumulative count of Article Views (full-text article views including HTML views, PDF and ePub downloads, according to the available data) and Abstracts Views on Vision4Press platform.
Data correspond to usage on the plateform after 2015. The current usage metrics is available 48-96 hours after online publication and is updated daily on week days.
Initial download of the metrics may take a while.