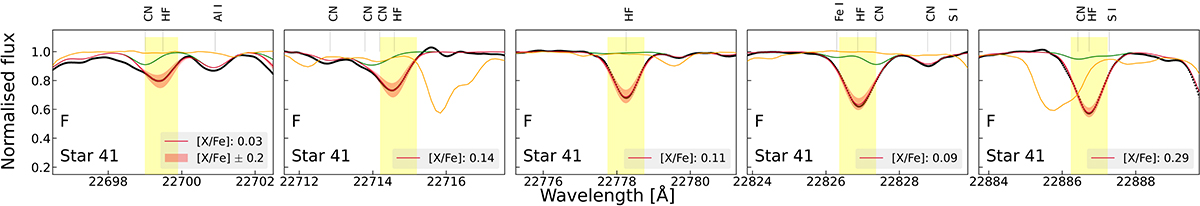
Fig. A.1.
Download original image
Wavelength regions centered at the five selected fluorine lines for the star 2M18103303-1626220 (star 41). In each panel, the black circles denote the observed spectrum, the crimson line denotes the best-fit synthetic spectrum, and the red band denotes the variation in the synthetic spectrum for a difference of ±0.2 dex in the [F/Fe]. The yellow bands in each panel represent the line masks defined for the F lines, wherein SME fits observed spectra by varying the fluorine abundance and finds the best synthetic spectra fit by χ2 minimization. The green line shows the synthetic spectrum without F, also indicating any possible blends in the line, and the orange line shows the telluric spectrum of the standard star that is used to correct for telluric contaminations in the observed star spectrum. The [F/Fe] values corresponding to the best-fit case for each F line are listed in each panel. All identified atomic and molecular lines are also denoted at the top of each panel.
Current usage metrics show cumulative count of Article Views (full-text article views including HTML views, PDF and ePub downloads, according to the available data) and Abstracts Views on Vision4Press platform.
Data correspond to usage on the plateform after 2015. The current usage metrics is available 48-96 hours after online publication and is updated daily on week days.
Initial download of the metrics may take a while.