Open Access
Fig. 23.
Download original image
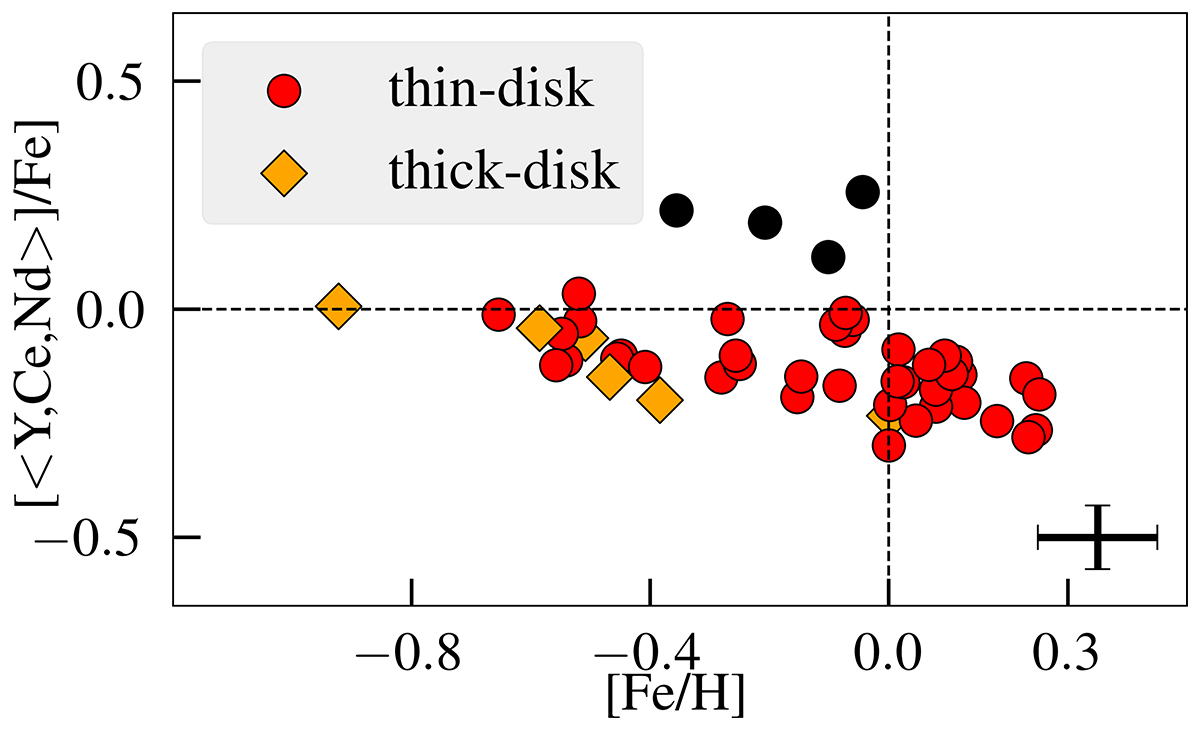
Mean abundances of the three s-process elements, Y, Ce, and Nd, versus [Fe/H] for 50 M giants in our sample. Black filled circles represent the stars that show high abundances of all these s-process elements at the same time. The remaining markers are similar to Fig. 1.
Current usage metrics show cumulative count of Article Views (full-text article views including HTML views, PDF and ePub downloads, according to the available data) and Abstracts Views on Vision4Press platform.
Data correspond to usage on the plateform after 2015. The current usage metrics is available 48-96 hours after online publication and is updated daily on week days.
Initial download of the metrics may take a while.