Fig. 1.
Download original image
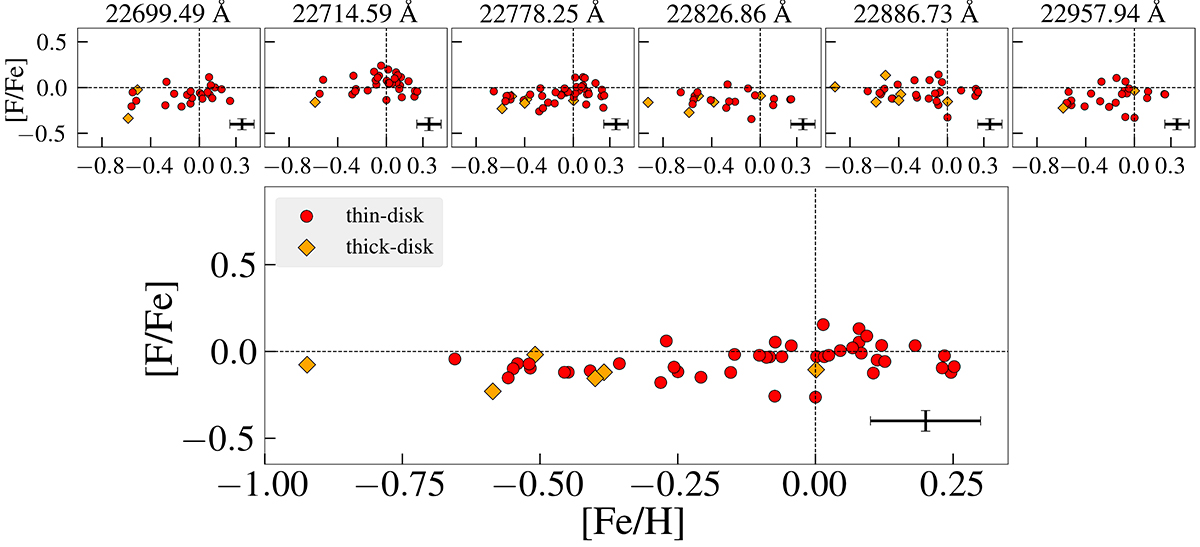
[F/Fe] versus [Fe/H] trends for 50 M giants in our sample. Figures in the upper panel show the trends determined from five individual HF lines. The mean [F/Fe] versus [Fe/H] trend from all six lines is shown in the bottom panel. Red filled circles and orange diamonds denote the thin- and thick-disk stars, respectively. The error bar in the bottom-right part of the top panels and the bottom panel indicate the uncertainties in abundances determined from each line and the mean uncertainty determined as the standard error of mean (see text in the Sect. 4 for more details).
Current usage metrics show cumulative count of Article Views (full-text article views including HTML views, PDF and ePub downloads, according to the available data) and Abstracts Views on Vision4Press platform.
Data correspond to usage on the plateform after 2015. The current usage metrics is available 48-96 hours after online publication and is updated daily on week days.
Initial download of the metrics may take a while.