Fig. 8.
Download original image
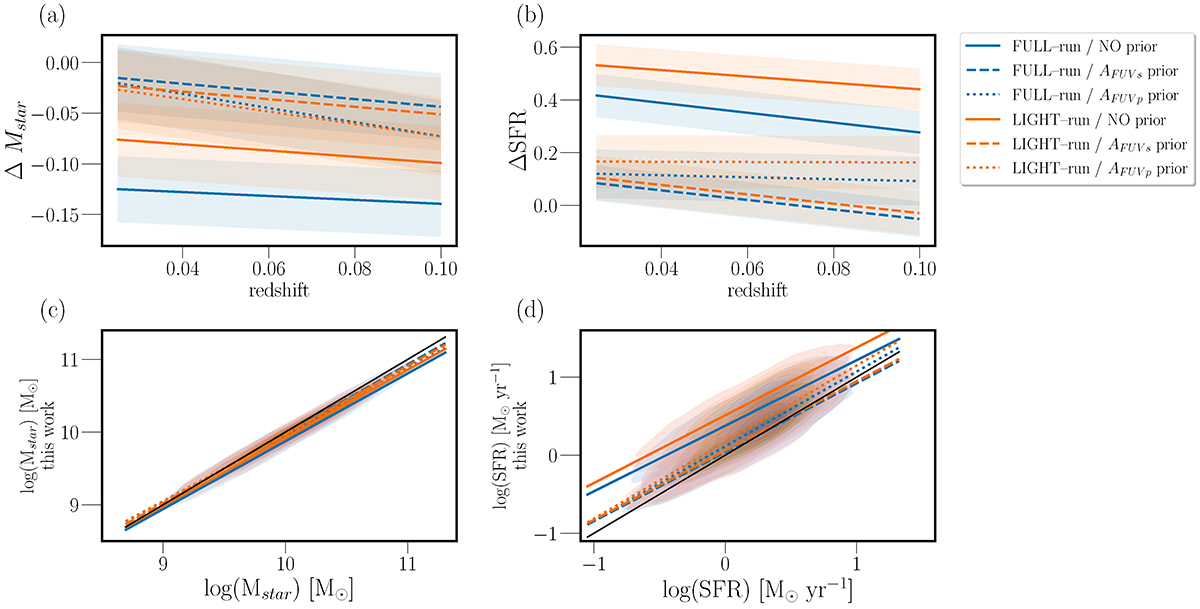
Difference between SFR and Mstar from the original GSWLC catalogue (Salim et al. 2018), and those obtained in this work. The difference ΔMstar was calculated as log(Mstar this work/Mstar); and ΔSFR was obtained in an analogous way. Panels a and b show the difference in the stellar masses and SFRs, correspondingly, as a function of redshift, with shaded areas represent standard deviation of the scatter; panels c and d present the relation between the fiducial values and the estimates obtained in this work, with contours showing the distribution of the data. Runs based on GSWLC set of parameters, FULL–run, are shown in blue-coloured lines, while those obtained from LIGHT–run – in an orange-coloured set of lines. Black solid lines visible in panels c and d represent 1:1 relations.
Current usage metrics show cumulative count of Article Views (full-text article views including HTML views, PDF and ePub downloads, according to the available data) and Abstracts Views on Vision4Press platform.
Data correspond to usage on the plateform after 2015. The current usage metrics is available 48-96 hours after online publication and is updated daily on week days.
Initial download of the metrics may take a while.