Fig. 7.
Download original image
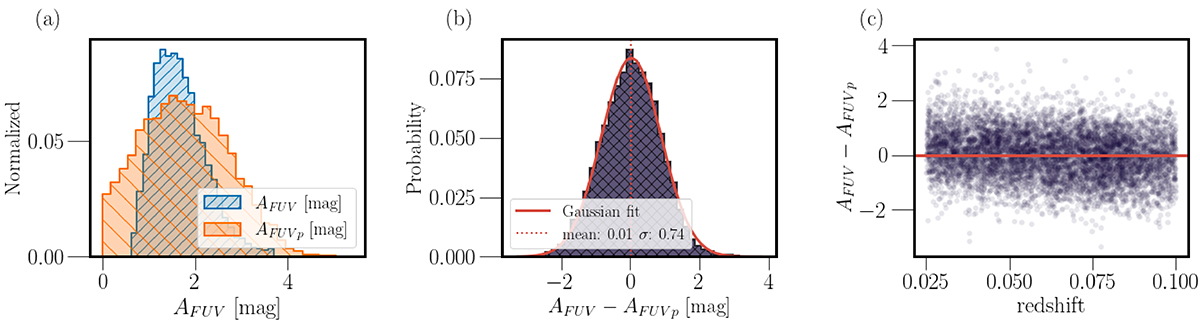
Main properties of obtained AFUV priors. Panel a shows the distributions of original AFUV from the Salim et al. (2018) work obtained from careful SED fitting based on measurements from UV to mid-IR (AFUV, blue left hatched histogram), and AFUVp calculated based on Eq. (4) (orange right hatched histogram). Panel b presents the distribution of the difference between AFUV and AFUVp and denotes its median value. In panel c, the difference between AFUV and AFUVp is shown as a function of redshift. We removed for clarity from panel a 426 galaxies, for which calculated AFUVp was lower than 0.
Current usage metrics show cumulative count of Article Views (full-text article views including HTML views, PDF and ePub downloads, according to the available data) and Abstracts Views on Vision4Press platform.
Data correspond to usage on the plateform after 2015. The current usage metrics is available 48-96 hours after online publication and is updated daily on week days.
Initial download of the metrics may take a while.