Open Access
Fig. 3.
Download original image
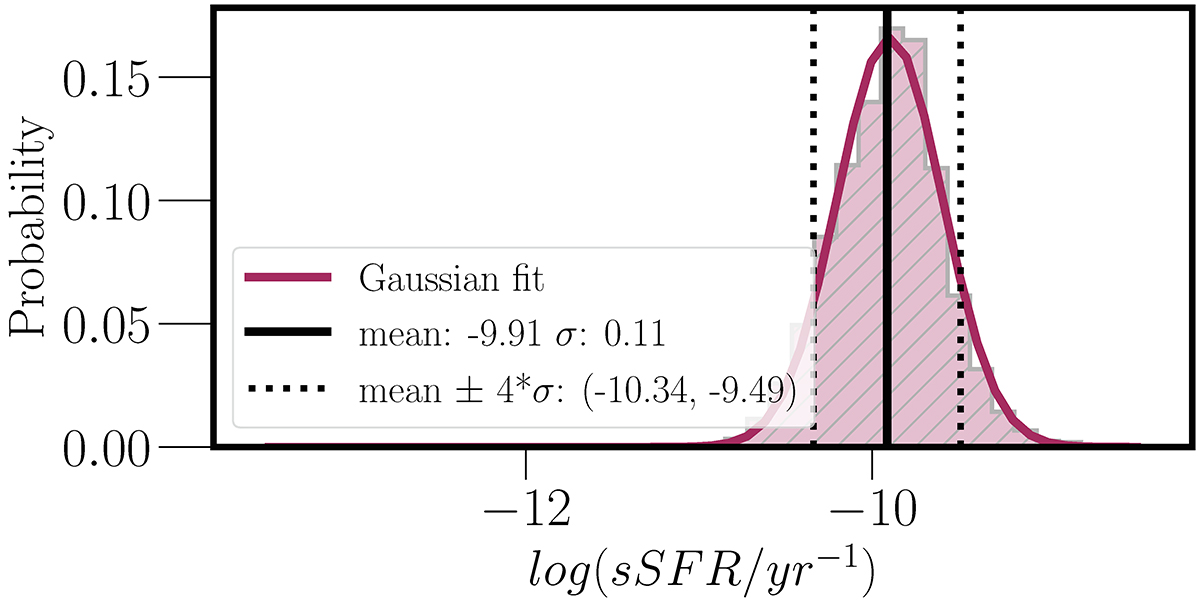
Distribution of log(sSFR/yr−1) for the selected 7 986 galaxies in the redshift range 0.025 < z < 0.1. A vertical solid line and two vertical dotted lines represent the mean value of sSFR of the sample, and the mean value of the sSFR decreased/increased by 4σ of the distribution, respectively.
Current usage metrics show cumulative count of Article Views (full-text article views including HTML views, PDF and ePub downloads, according to the available data) and Abstracts Views on Vision4Press platform.
Data correspond to usage on the plateform after 2015. The current usage metrics is available 48-96 hours after online publication and is updated daily on week days.
Initial download of the metrics may take a while.