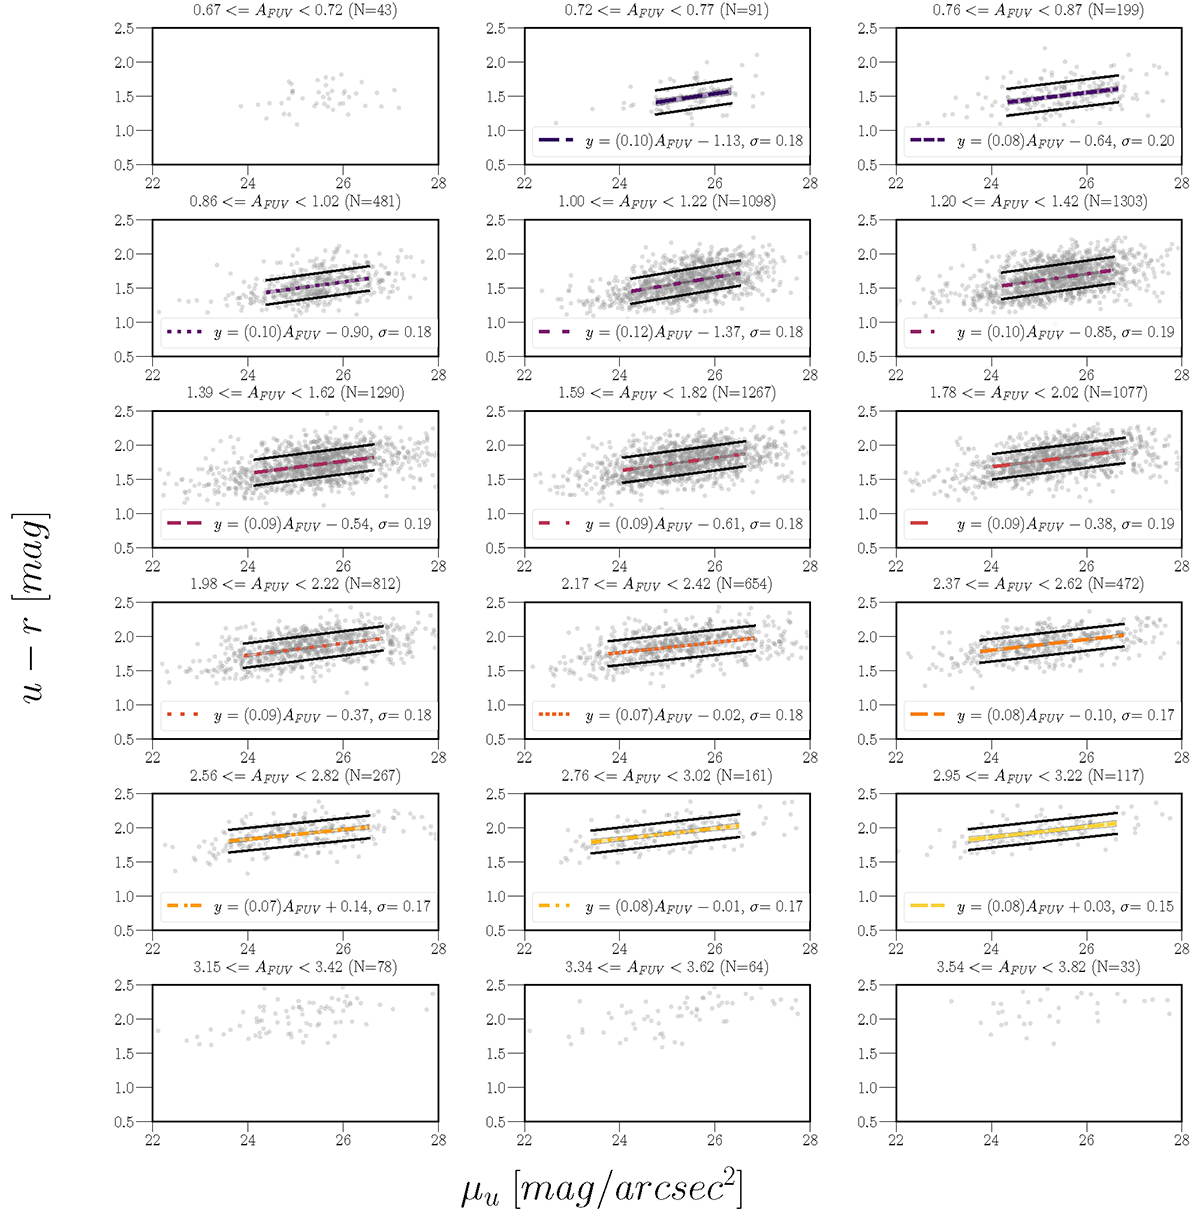
Fig. D.1.
Download original image
Relation between observed (u−r) and μu for the sample of 7 934 galaxies divided into 14 AFUV bins. Each panel represents consecutive AFUV bins (Fig. 4 and Table 2). The resulting slope and intercept of the fit are provided within each corresponding panel. The deviation of the (u−r) colour from the linear fit (Δur) and the variability of AFUV within the range of ±1σ from the linear fit (σAFUV) are both indicated in each panel.
Current usage metrics show cumulative count of Article Views (full-text article views including HTML views, PDF and ePub downloads, according to the available data) and Abstracts Views on Vision4Press platform.
Data correspond to usage on the plateform after 2015. The current usage metrics is available 48-96 hours after online publication and is updated daily on week days.
Initial download of the metrics may take a while.