Open Access
Fig. A.2.
Download original image
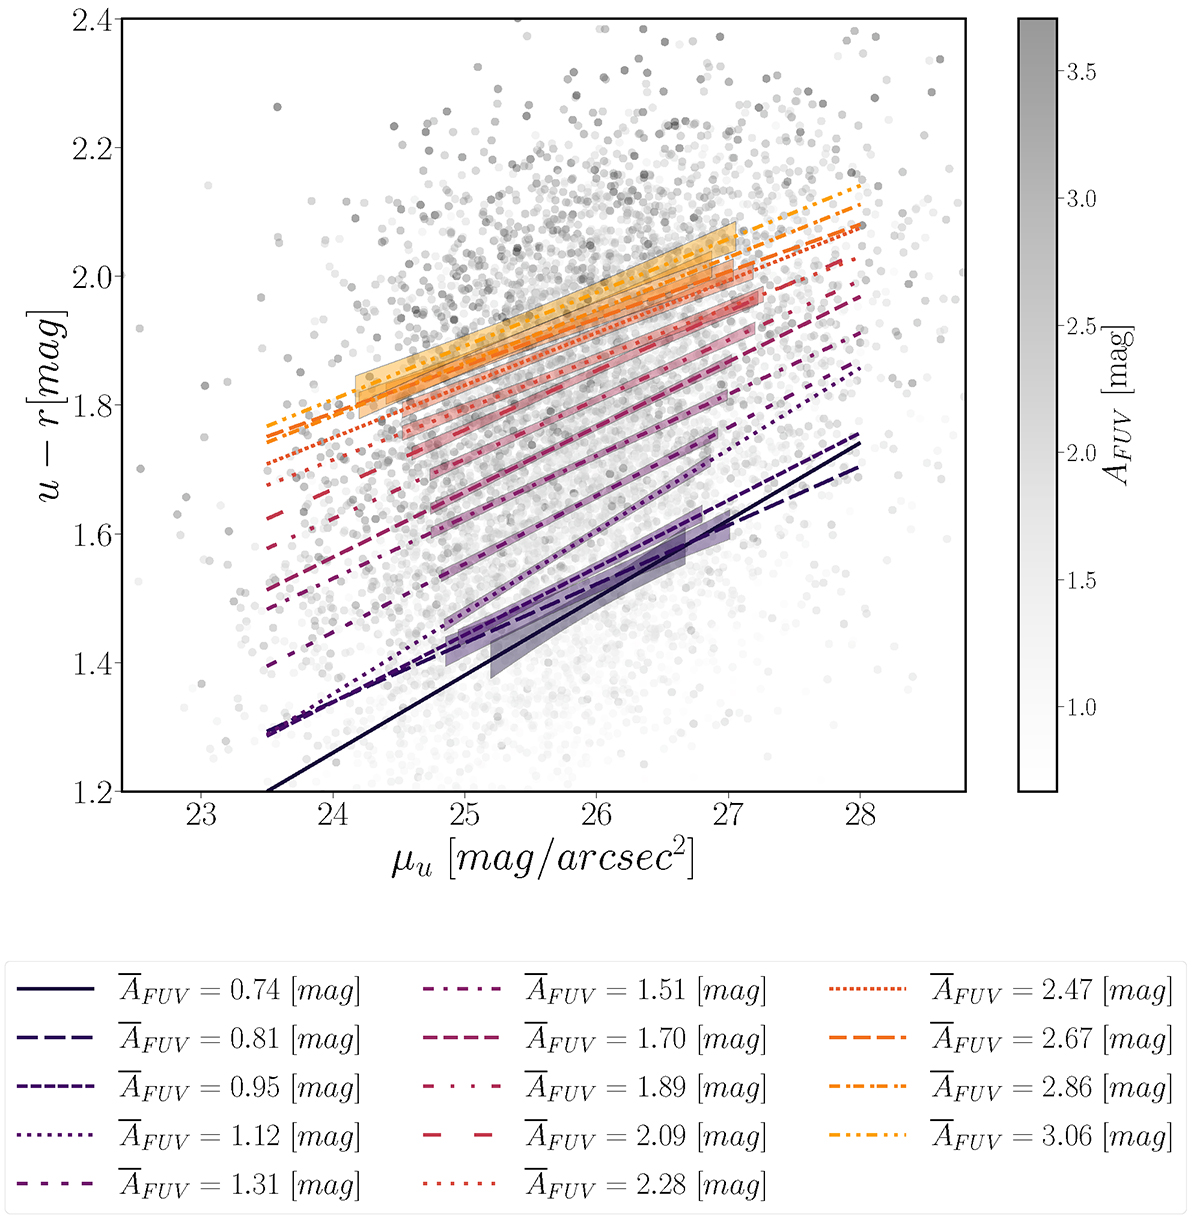
Relations fitted between observed (u−r) colours and μu for 14 AFUV bins with additional background showing all galaxies used in our analysis. The grey scale colour bar axis shows the value of the AFUV.
Current usage metrics show cumulative count of Article Views (full-text article views including HTML views, PDF and ePub downloads, according to the available data) and Abstracts Views on Vision4Press platform.
Data correspond to usage on the plateform after 2015. The current usage metrics is available 48-96 hours after online publication and is updated daily on week days.
Initial download of the metrics may take a while.