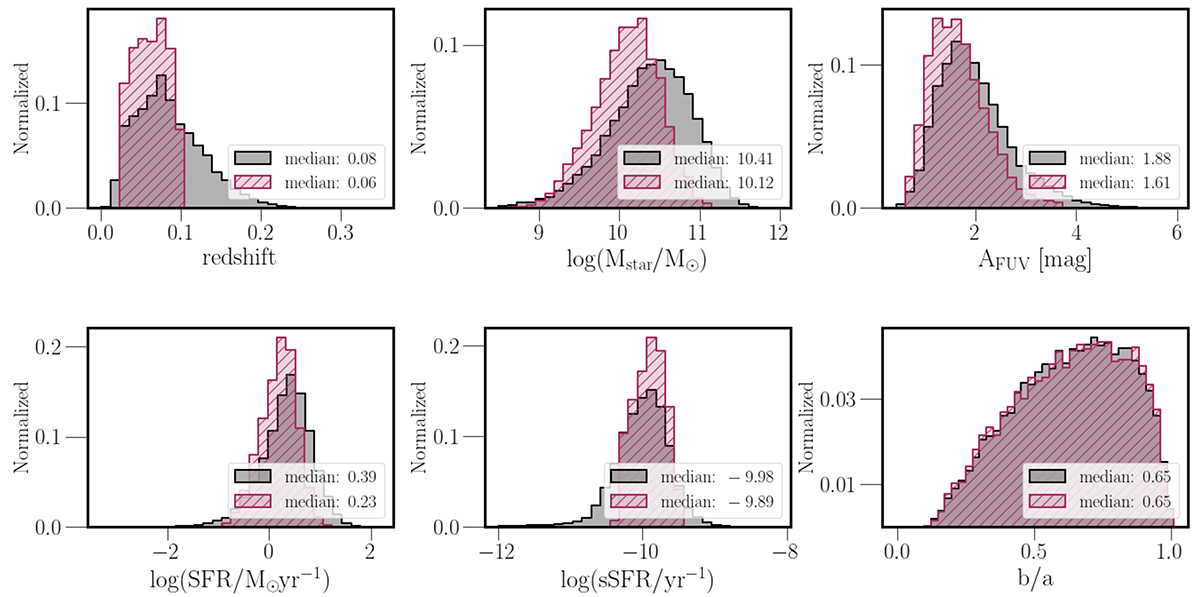
Fig. 1.
Download original image
Main physical properties used in our analysis. Panels above show spectroscopic redshift, stellar mass (log(Mstar/M⊙)), attenuation in the FUV band (AFUV), SFR and specific SFR (sSFR), both in logarithmic scale. The last bottom right panel shows the axis ratio (semi-minor/semi-major) from Meert et al. (2015). Black histograms represent distributions obtained from the whole sample of 29 487 galaxies (0.01 < z < 0.30), while maroon hatched histograms show distributions for the final sample used for the analysis (7986 galaxies). Legends show median values for all parameters calculated for the initial (black histograms) and final (maroon hatched histograms) samples.
Current usage metrics show cumulative count of Article Views (full-text article views including HTML views, PDF and ePub downloads, according to the available data) and Abstracts Views on Vision4Press platform.
Data correspond to usage on the plateform after 2015. The current usage metrics is available 48-96 hours after online publication and is updated daily on week days.
Initial download of the metrics may take a while.