Open Access
Fig. A.1.
Download original image
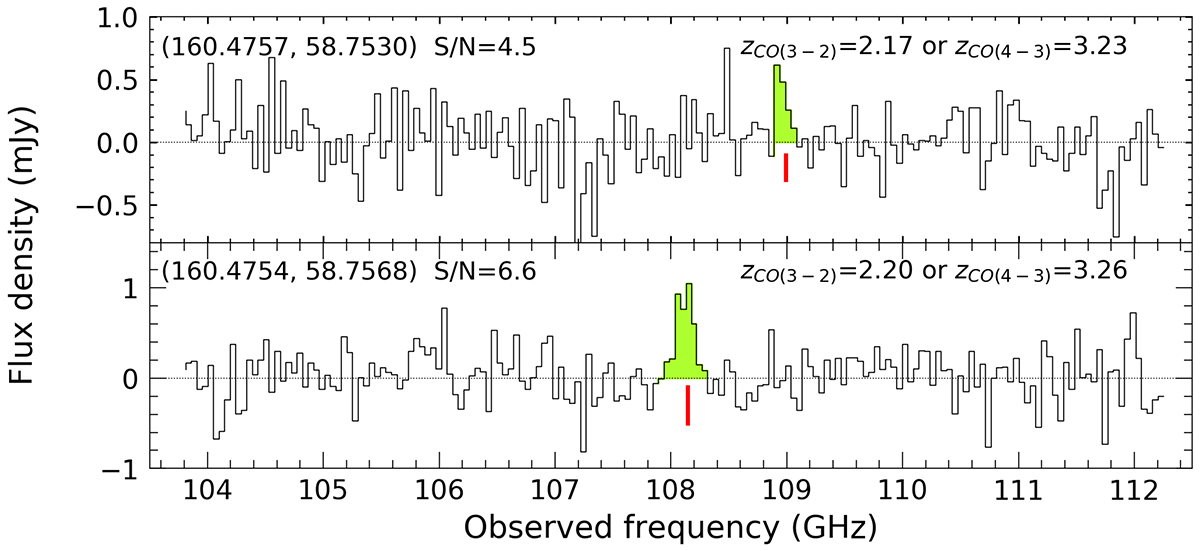
Spectra of the two galaxies detected at 108GHz as discussed in Section 3. The emission lines are highlighted in yellow with the red vertical bars indicating the line centres. The coordinates, the signal-to-noise ratio of the lines, and the implied redshifts are marked.
Current usage metrics show cumulative count of Article Views (full-text article views including HTML views, PDF and ePub downloads, according to the available data) and Abstracts Views on Vision4Press platform.
Data correspond to usage on the plateform after 2015. The current usage metrics is available 48-96 hours after online publication and is updated daily on week days.
Initial download of the metrics may take a while.