Fig. 3.
Download original image
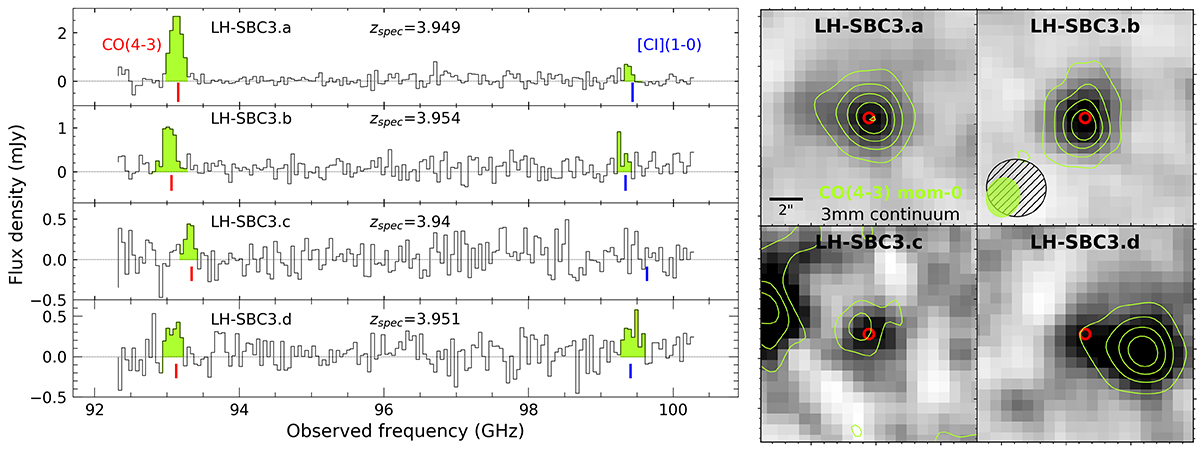
The four members of LH-SBC3 spectroscopically confirmed by NOEMA. Left: NOEMA spectra of four confirmed cluster members. The channel width of the spectra is rebinned to be ∼150 km s−1. The detected lines are highlighted in yellow. CO(4–3) and [CI](1–0) frequencies are marked by vertical bars in red and blue, respectively. Right: 3 mm continuum images of the four members overlaid by CO(4–3) intensity contours in yellow. The red circles denote the positions of the galaxies determined by the flux peak of the 3 mm continuum. The CO(4–3) intensity contours start at 1σ (equivalent to ∼56 mJy km−1 beam−1) in steps of 1σ. Beams of the 3 mm and CO(4–3) intensity maps are shown in the second panel as black-hatched and yellow patterns corresponding to 3.43″ × 3.60″and 2.37″ × 2.02″, respectively.
Current usage metrics show cumulative count of Article Views (full-text article views including HTML views, PDF and ePub downloads, according to the available data) and Abstracts Views on Vision4Press platform.
Data correspond to usage on the plateform after 2015. The current usage metrics is available 48-96 hours after online publication and is updated daily on week days.
Initial download of the metrics may take a while.