Fig. 2.
Download original image
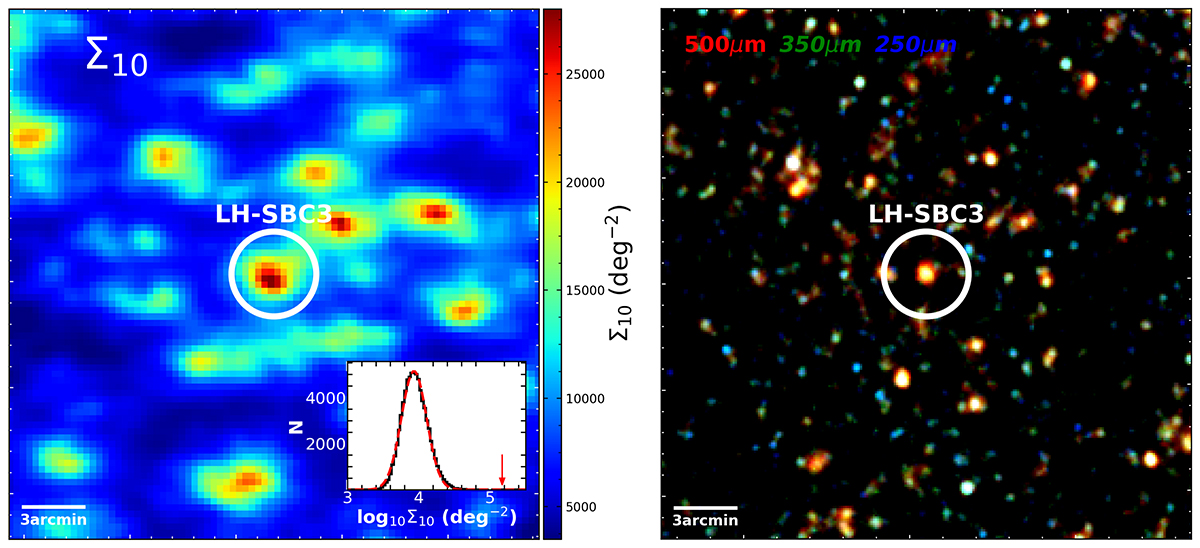
LH-SBC3 selected following the method in Sect. 2.2. Left: smoothed Σ10 map of the red IRAC priors (Eq. (1)) over the 25′×25′ area around LH-SBC3. The construction of the map is described in Sect. 2.2.1. The inserted histogram is the distribution of Σ10 (black histogram) and the Gaussian fit (red dashed curve). The red arrow indicates the peak Σ10 value of LH-SBC3. Right: Herschel/SPIRE composite color image of the same area. The R, G, and B channels correspond to 500 μm, 350 μm, and 250 μm, respectively. The white circles in both figures have a radius of 2′.
Current usage metrics show cumulative count of Article Views (full-text article views including HTML views, PDF and ePub downloads, according to the available data) and Abstracts Views on Vision4Press platform.
Data correspond to usage on the plateform after 2015. The current usage metrics is available 48-96 hours after online publication and is updated daily on week days.
Initial download of the metrics may take a while.