Open Access
Fig. 7.
Download original image
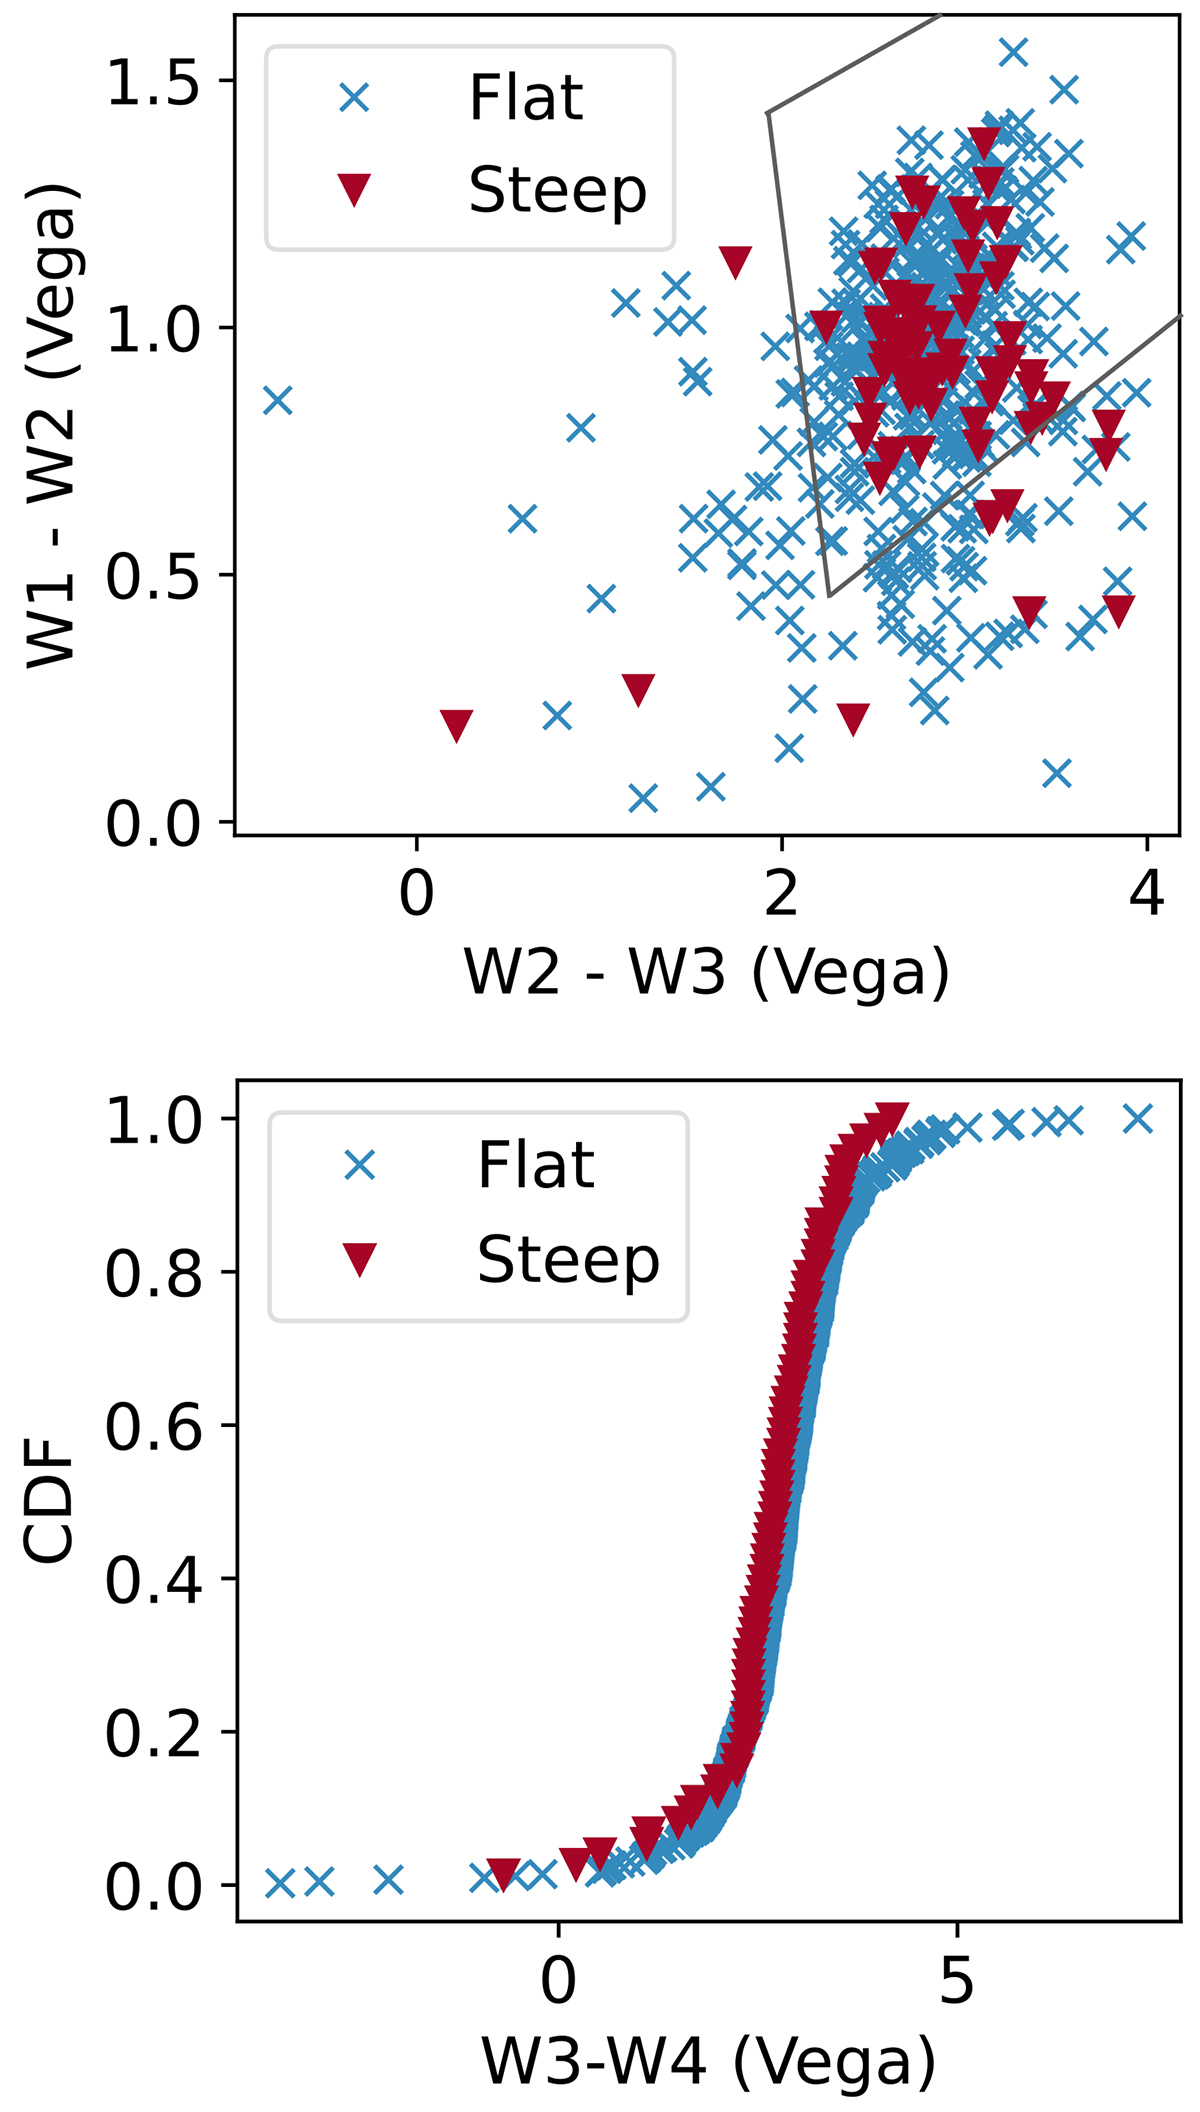
Infrared colours of the steep- and flat-spectrum sources. Symbols are the same as in Fig. 1. Upper: WISE colour–colour diagram of W1 − W2 against W2 − W3. The AGN wedge proposed by Mateos et al. (2012) is drawn as a grey solid line. Lower: cumulative density function of W3 − W4 of flat-spectrum and steep-spectrum sources.
Current usage metrics show cumulative count of Article Views (full-text article views including HTML views, PDF and ePub downloads, according to the available data) and Abstracts Views on Vision4Press platform.
Data correspond to usage on the plateform after 2015. The current usage metrics is available 48-96 hours after online publication and is updated daily on week days.
Initial download of the metrics may take a while.