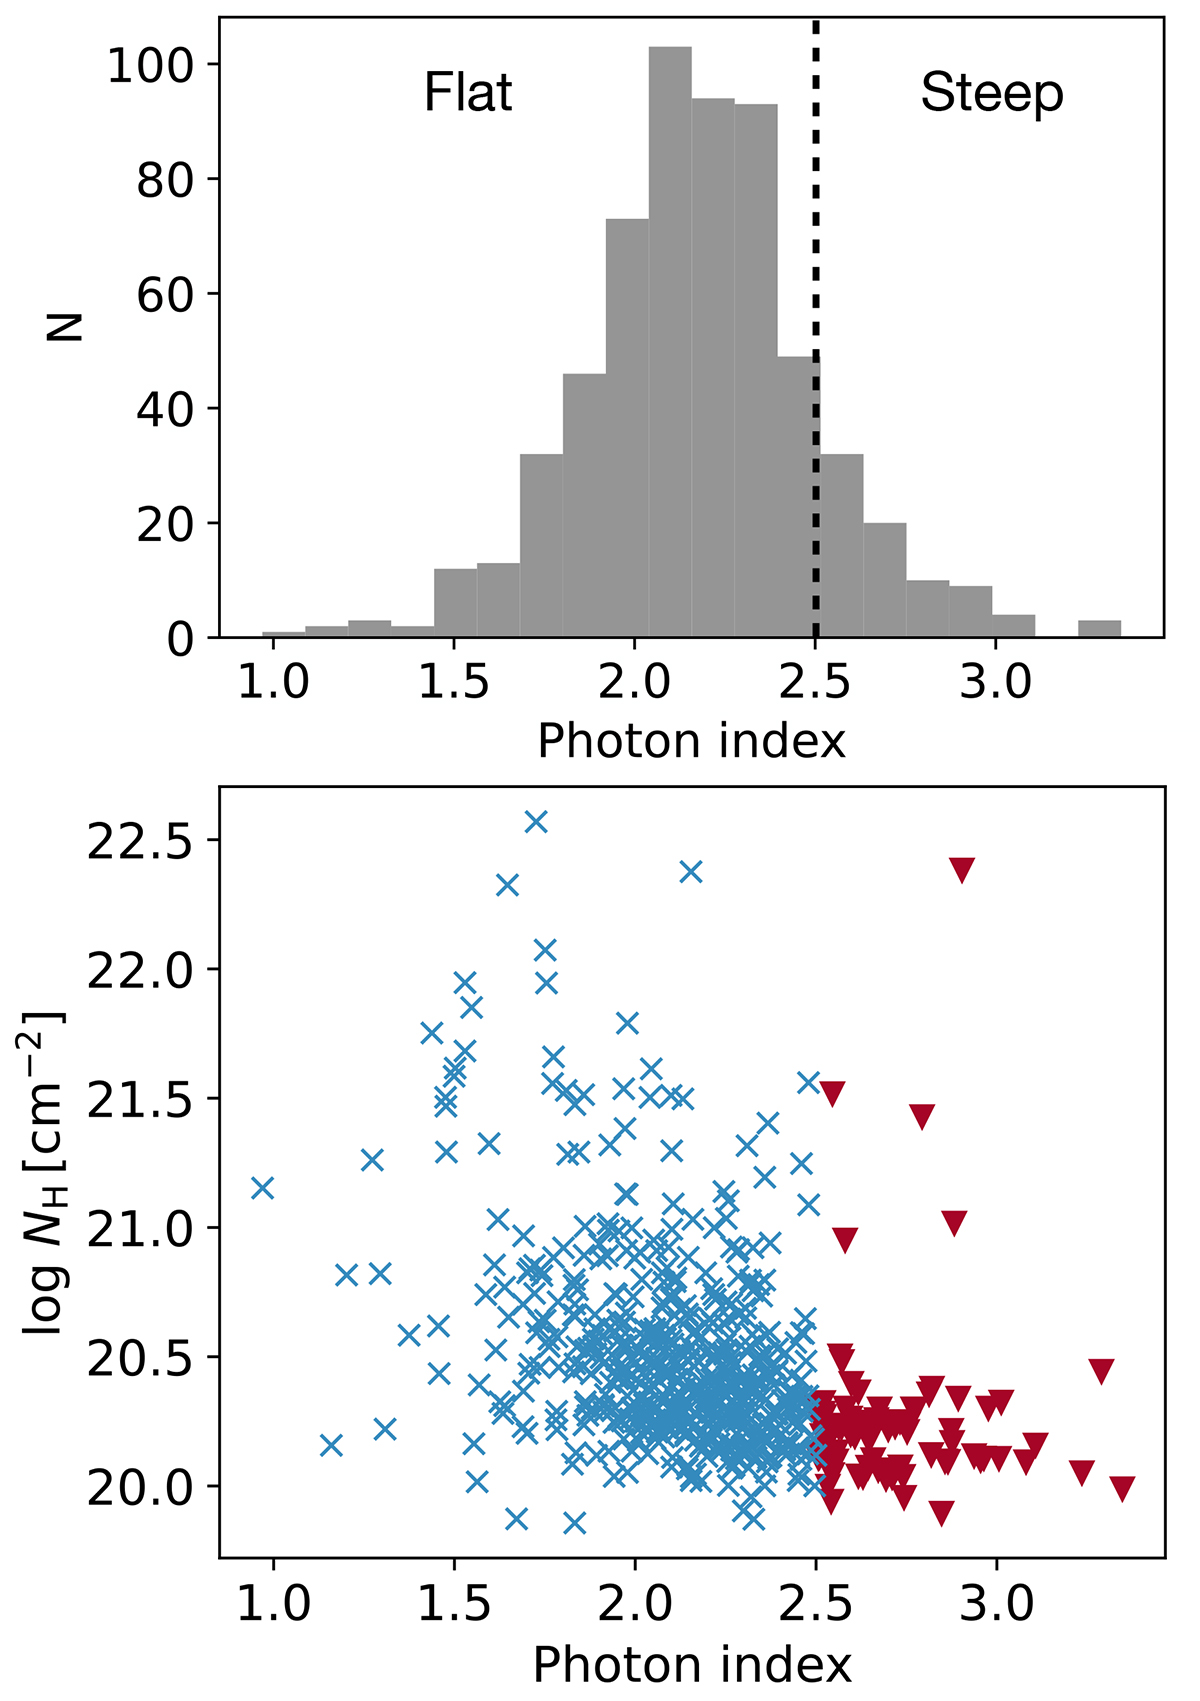
Fig. 2.
Download original image
Distribution of the soft X-ray photon index and absorbing column of the whole bright AGN sample of 601 sources. Upper panel: photon index distribution. The vertical dashed line indicates the boundary of Γ = 2.5 between the flat- and steep-spectrum sources. Lower panel: flat- and steep-spectrum sources (symbols are the same as in Fig. 1) in the photon-index–log NH plane.
Current usage metrics show cumulative count of Article Views (full-text article views including HTML views, PDF and ePub downloads, according to the available data) and Abstracts Views on Vision4Press platform.
Data correspond to usage on the plateform after 2015. The current usage metrics is available 48-96 hours after online publication and is updated daily on week days.
Initial download of the metrics may take a while.