Fig. 8
Download original image
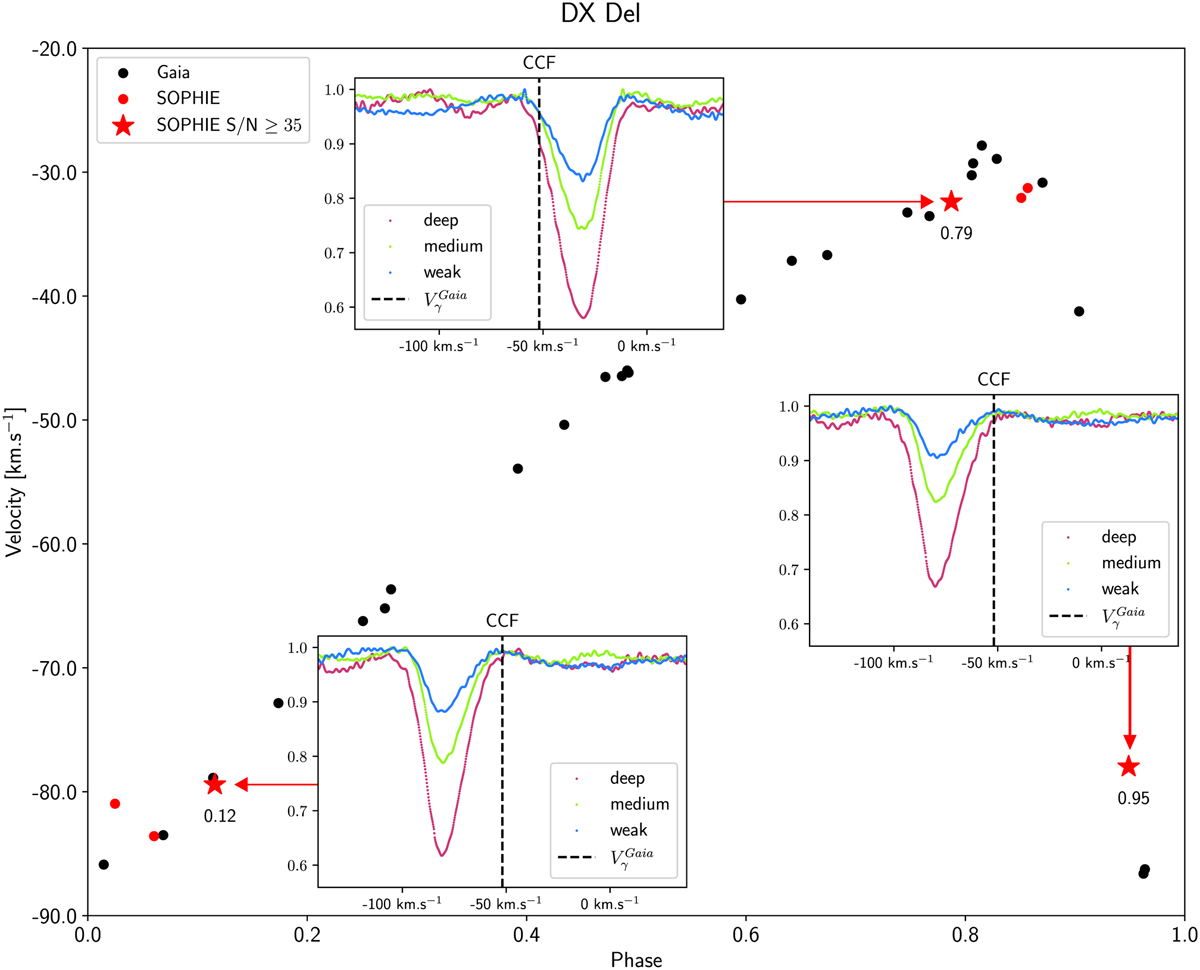
Evolution of the asymmetry of the CCF during the pulsation cycle of DX Del. The Gaia RV curve for this star is shown in black for global visualisation. The red markers represent the measurements from SOPHIE and the red stars locate three spectra with a high S/N where we can compute the CCF using the three masks with different depths, shown in the inserts. The dashed line shows the mean RV extracted from the Gaia catalogue.
Current usage metrics show cumulative count of Article Views (full-text article views including HTML views, PDF and ePub downloads, according to the available data) and Abstracts Views on Vision4Press platform.
Data correspond to usage on the plateform after 2015. The current usage metrics is available 48-96 hours after online publication and is updated daily on week days.
Initial download of the metrics may take a while.