Open Access
Fig. 6
Download original image
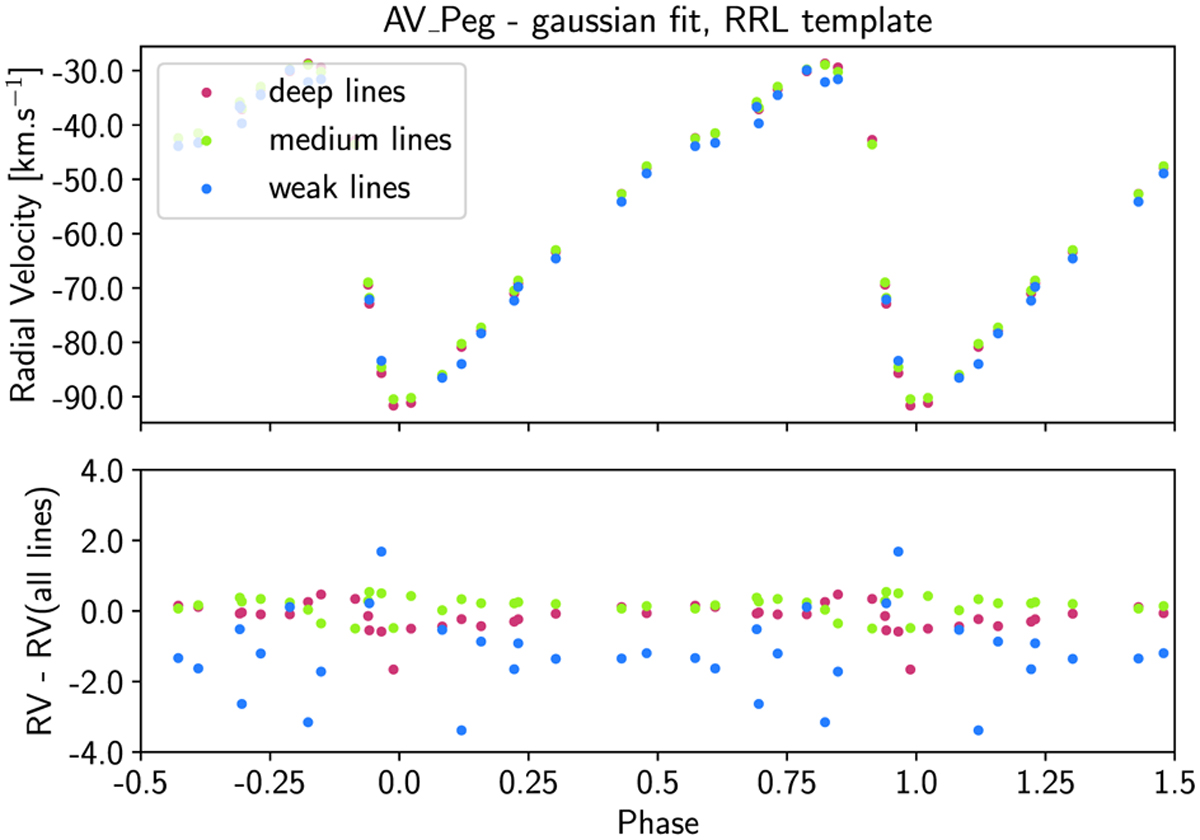
Comparison between weak, medium, deep, and all lines. This figure shows the RV curve from the cross-correlation of the spectra with a binary mask built for different line selection of AV Peg. The bottom plot shows the difference with the mask keeping all lines with a weight associated to its depth.
Current usage metrics show cumulative count of Article Views (full-text article views including HTML views, PDF and ePub downloads, according to the available data) and Abstracts Views on Vision4Press platform.
Data correspond to usage on the plateform after 2015. The current usage metrics is available 48-96 hours after online publication and is updated daily on week days.
Initial download of the metrics may take a while.