Open Access
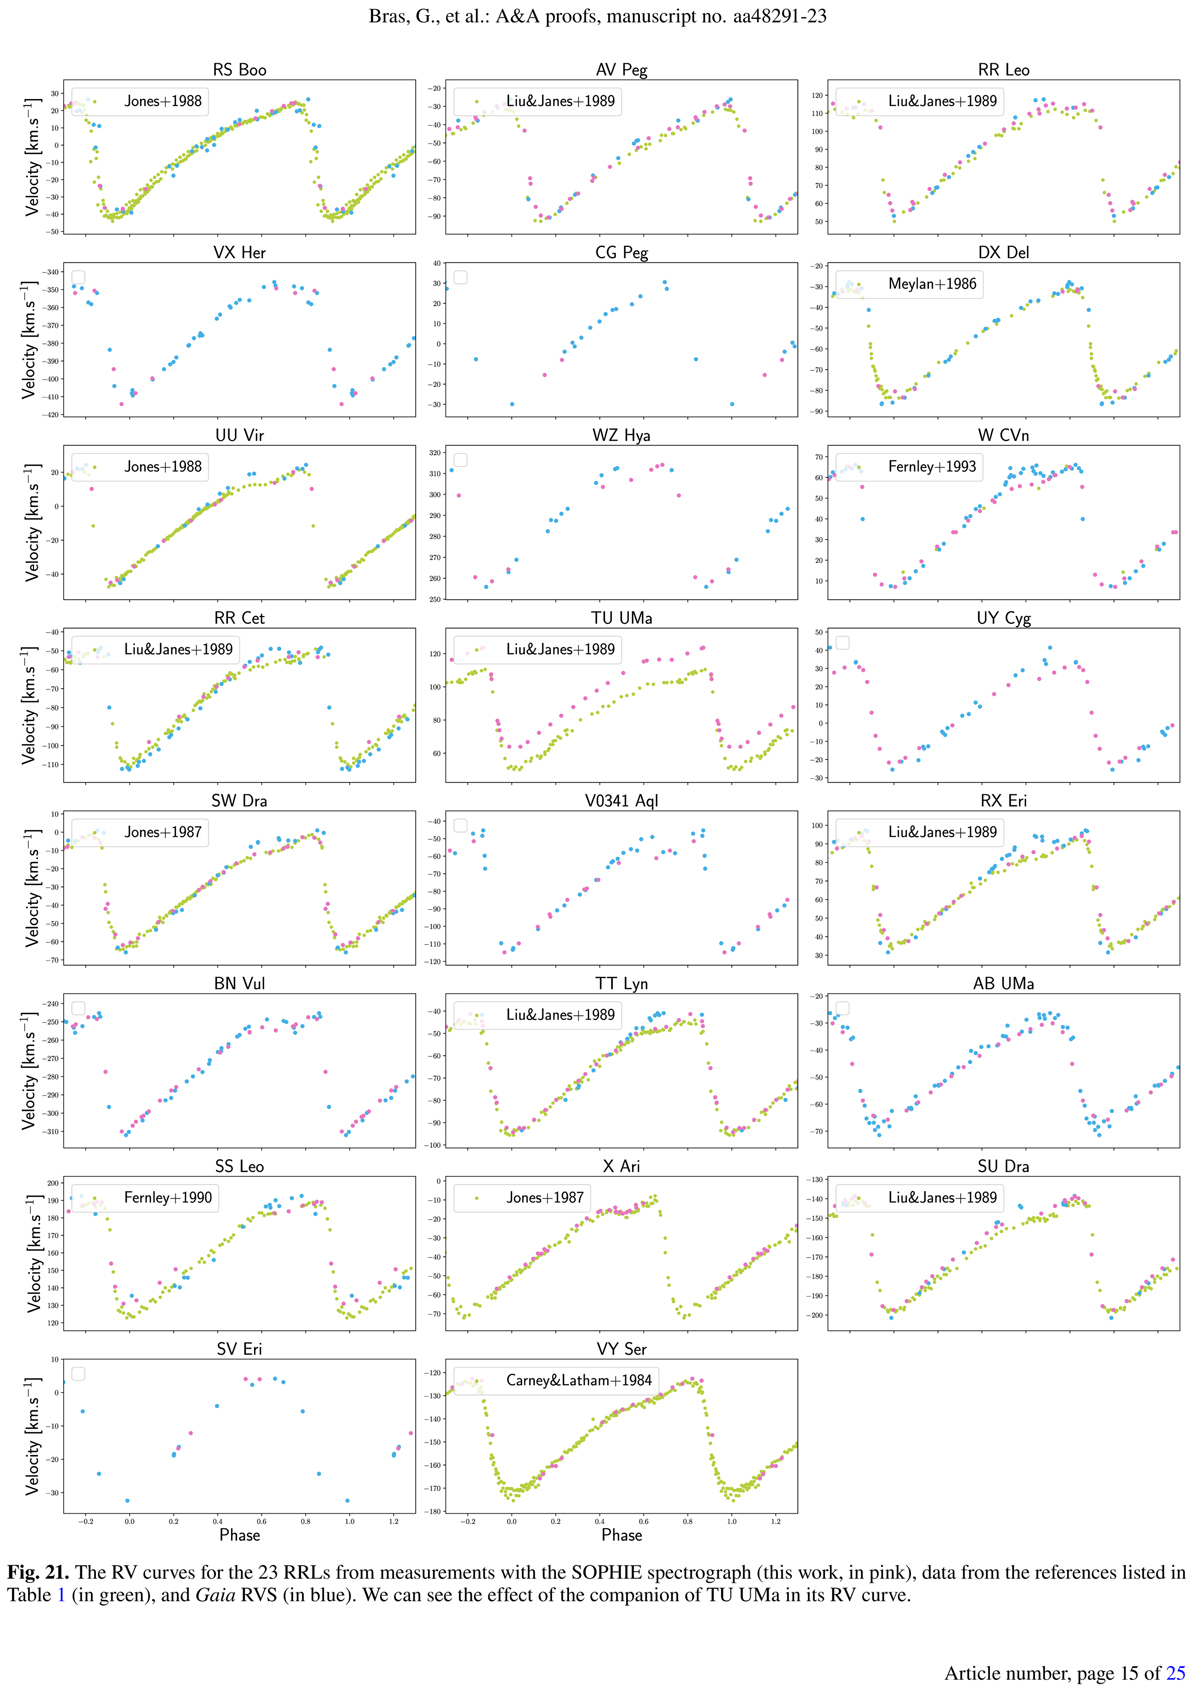
Fig. 21
Download original image
The RV curves for the 23 RRLs from measurements with the SOPHIE spectrograph (this work, in pink), data from the references listed in Table 1 (in green), and Gaia RVS (in blue). We can see the effect of the companion of TU UMa in its RV curve.
Current usage metrics show cumulative count of Article Views (full-text article views including HTML views, PDF and ePub downloads, according to the available data) and Abstracts Views on Vision4Press platform.
Data correspond to usage on the plateform after 2015. The current usage metrics is available 48-96 hours after online publication and is updated daily on week days.
Initial download of the metrics may take a while.