Open Access
Fig. 20
Download original image
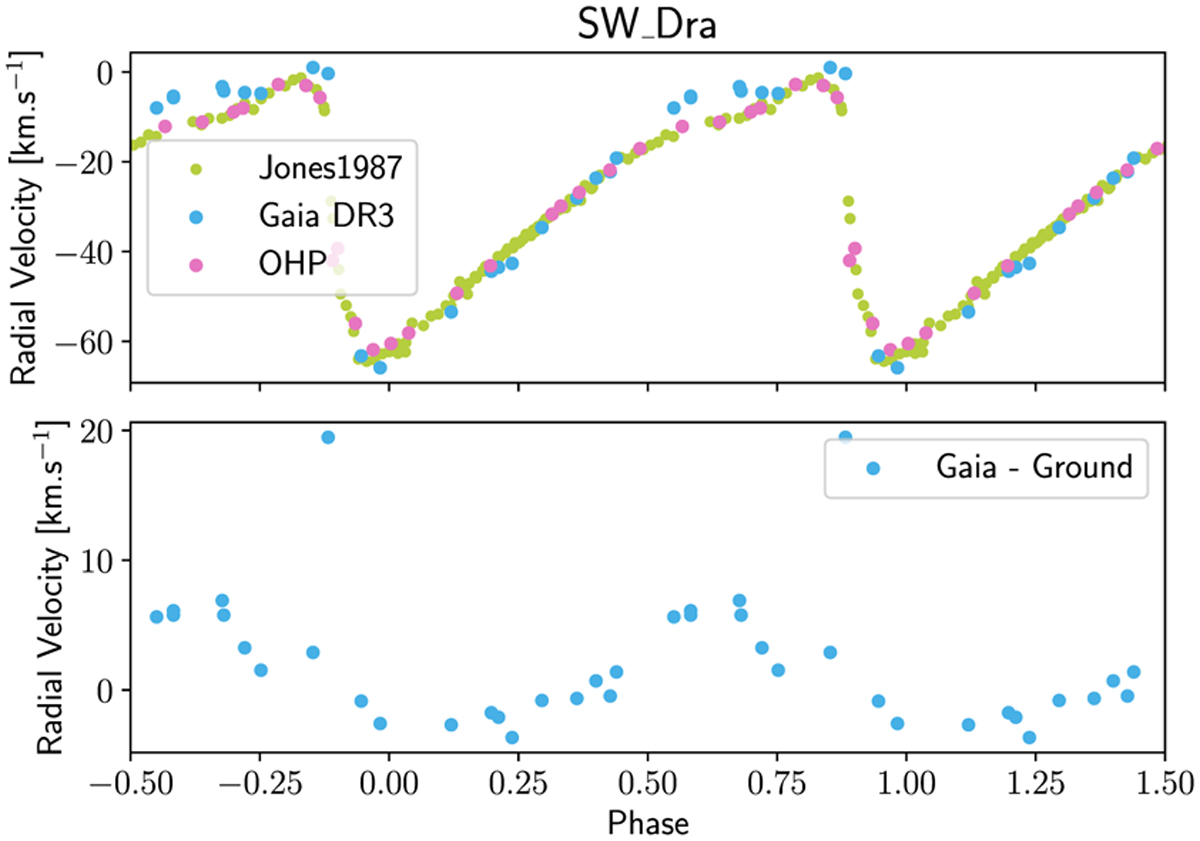
Comparison between the RV curves from the ground (Jones et al. 1987b, SOPHIE) and the Gaia series of SW Dra. The bottom plot is the difference between the Gaia RV series and the total ground RV curve.
Current usage metrics show cumulative count of Article Views (full-text article views including HTML views, PDF and ePub downloads, according to the available data) and Abstracts Views on Vision4Press platform.
Data correspond to usage on the plateform after 2015. The current usage metrics is available 48-96 hours after online publication and is updated daily on week days.
Initial download of the metrics may take a while.