Fig. 19
Download original image
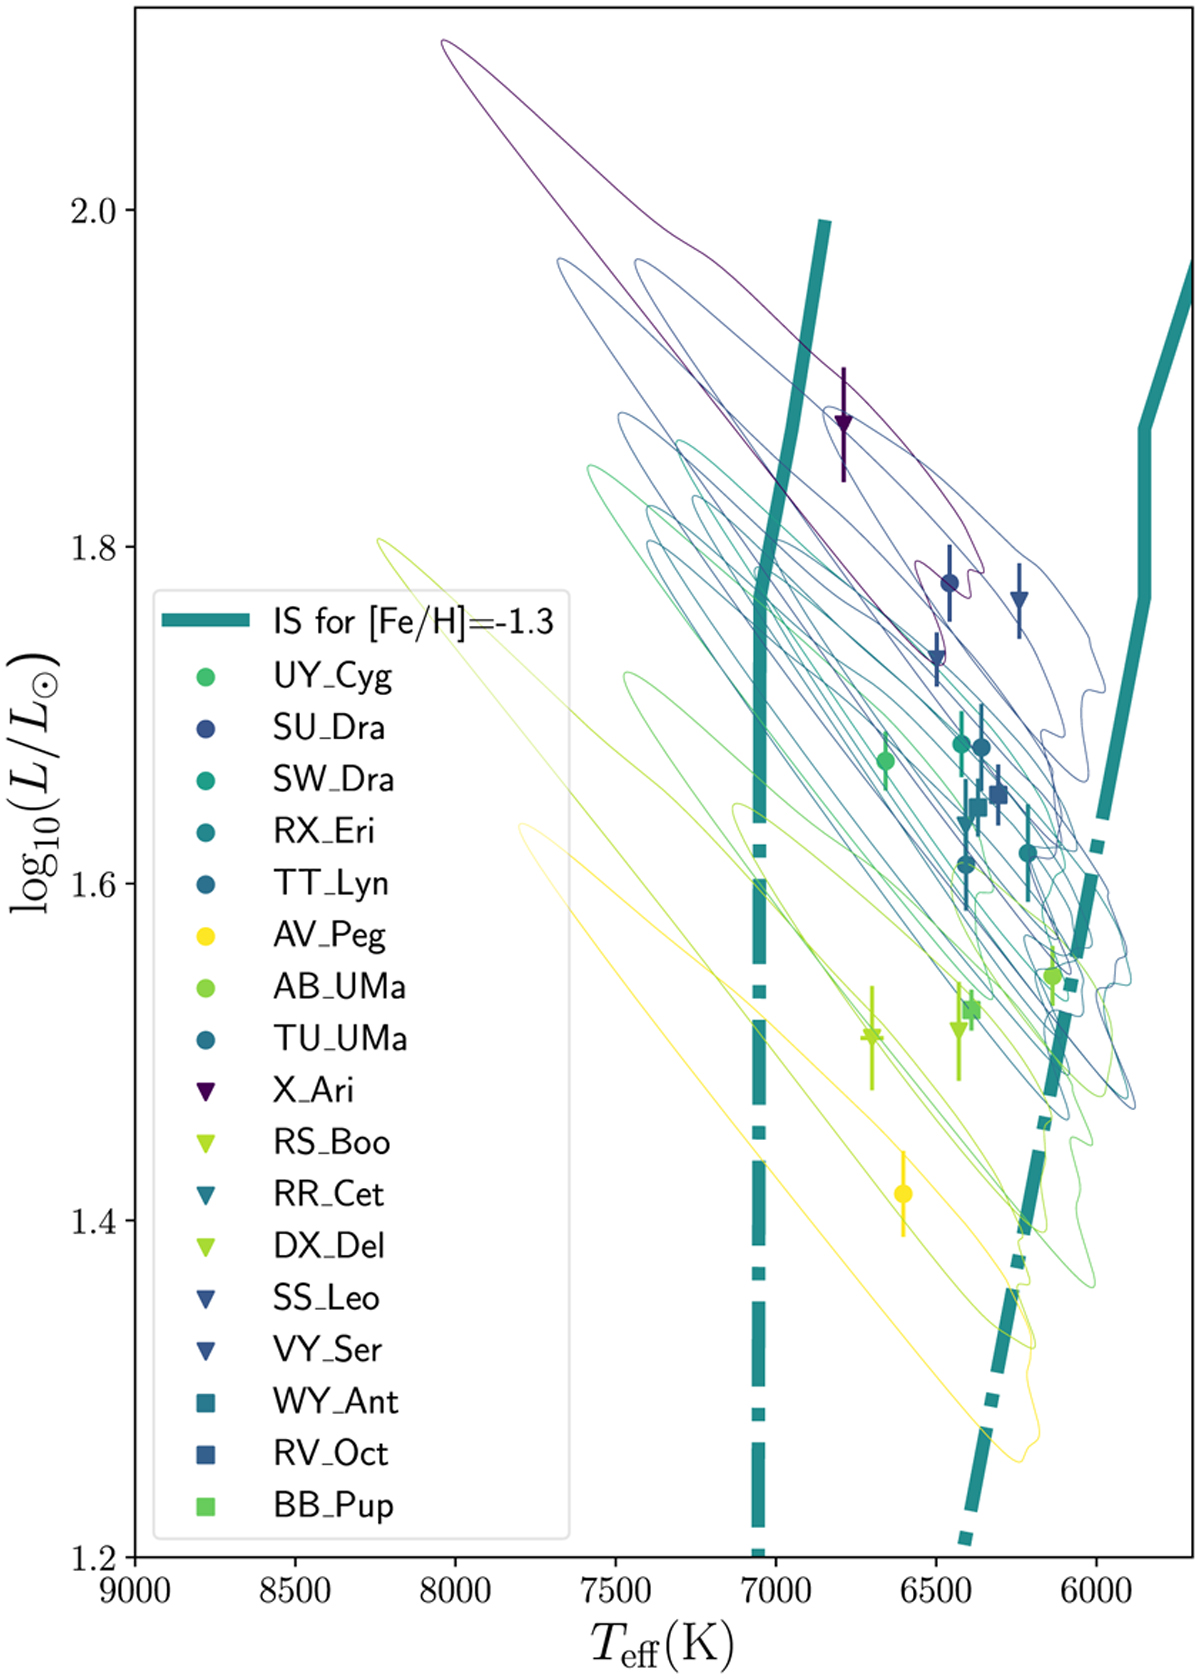
Hertzsprung-Russel diagram showing the pulsation cycle of the 17 modelled RRLs of our sample. Markers indicate the type of RV measurements used in the model (see legend of Fig. 14). Thick lines are the edges of the instability strip from models (Marconi et al. 2015) for a metallicity globally corresponding to RRLs. These predictions have been extended linearly to lower luminosities in semi-dotted lines.
Current usage metrics show cumulative count of Article Views (full-text article views including HTML views, PDF and ePub downloads, according to the available data) and Abstracts Views on Vision4Press platform.
Data correspond to usage on the plateform after 2015. The current usage metrics is available 48-96 hours after online publication and is updated daily on week days.
Initial download of the metrics may take a while.