Open Access
Fig. 16
Download original image
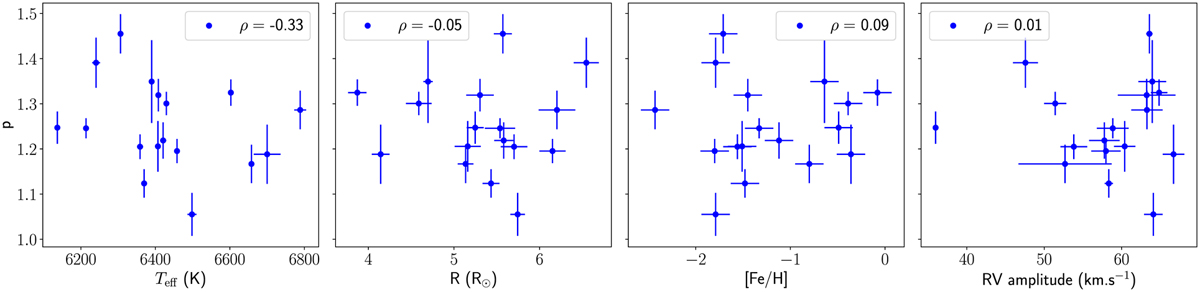
Comparison between the p-factor of 17 RRLs and effective temperature, mean radius, metallicity, and amplitude of the RV curve. For each plot, the Spearman’s coefficient is given to test the statistical probability of a monotonic relation between the p-factor and the other parameters.
Current usage metrics show cumulative count of Article Views (full-text article views including HTML views, PDF and ePub downloads, according to the available data) and Abstracts Views on Vision4Press platform.
Data correspond to usage on the plateform after 2015. The current usage metrics is available 48-96 hours after online publication and is updated daily on week days.
Initial download of the metrics may take a while.