Open Access
Fig. 11
Download original image
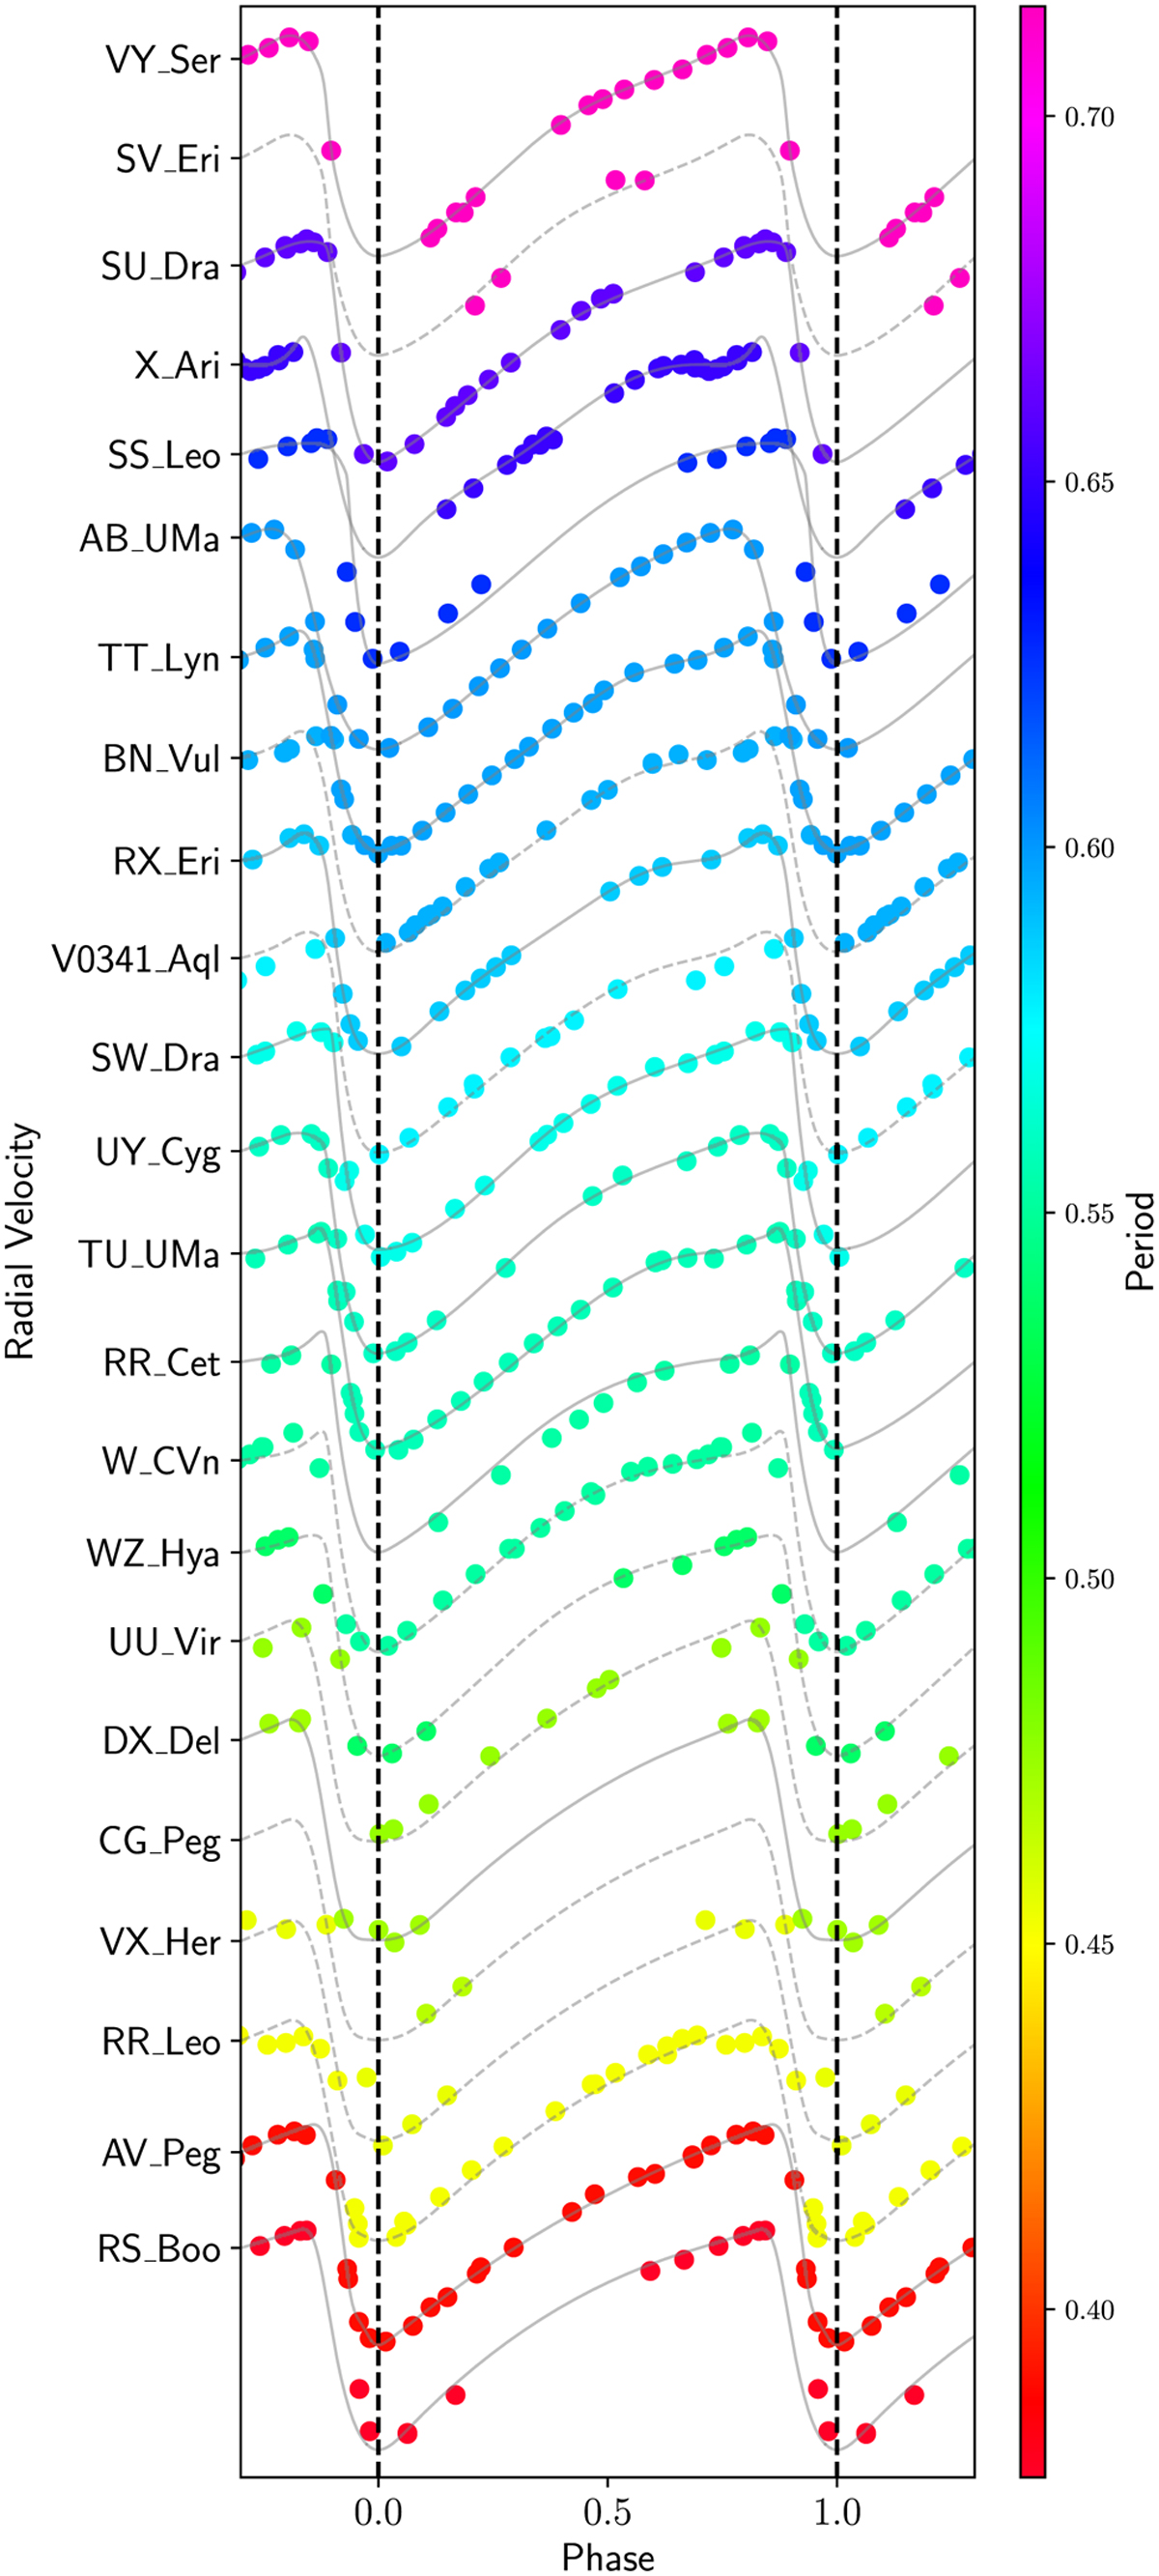
All RV curves obtained with the SOPHIE spectrograph. The curves have been normalised using Gaia parameters if an insufficient number of measurements was obtained. An offset in velocity is added to see all curves in a single plot, which is related to the period.
Current usage metrics show cumulative count of Article Views (full-text article views including HTML views, PDF and ePub downloads, according to the available data) and Abstracts Views on Vision4Press platform.
Data correspond to usage on the plateform after 2015. The current usage metrics is available 48-96 hours after online publication and is updated daily on week days.
Initial download of the metrics may take a while.