Open Access
Fig. 10
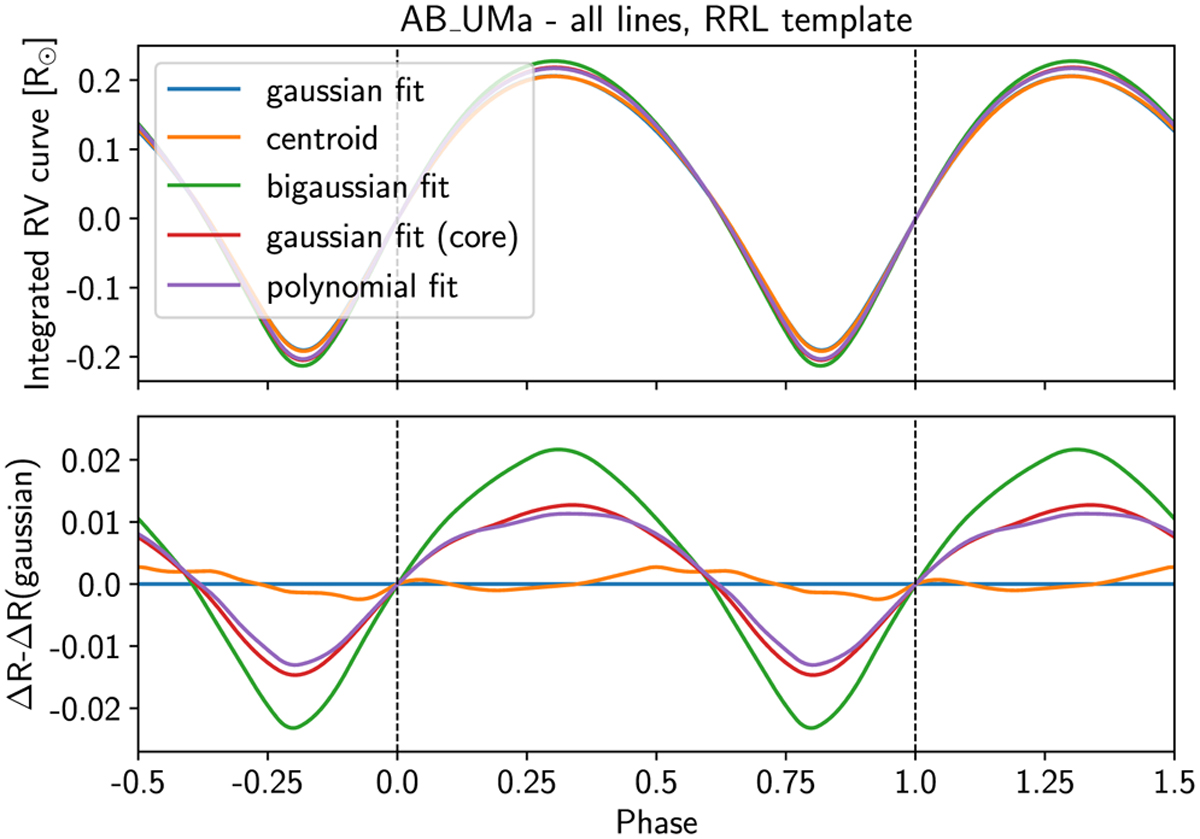
Download original image
Comparison of the impact of different CCF measurement methods on the radius curve of AB UMa (the RV curve is shown in Fig. 9). The bottom plot shows the difference from the more commonly used method, that is, the fit of a Gaussian profile to the CCF.
Current usage metrics show cumulative count of Article Views (full-text article views including HTML views, PDF and ePub downloads, according to the available data) and Abstracts Views on Vision4Press platform.
Data correspond to usage on the plateform after 2015. The current usage metrics is available 48-96 hours after online publication and is updated daily on week days.
Initial download of the metrics may take a while.