Fig. 6
Download original image
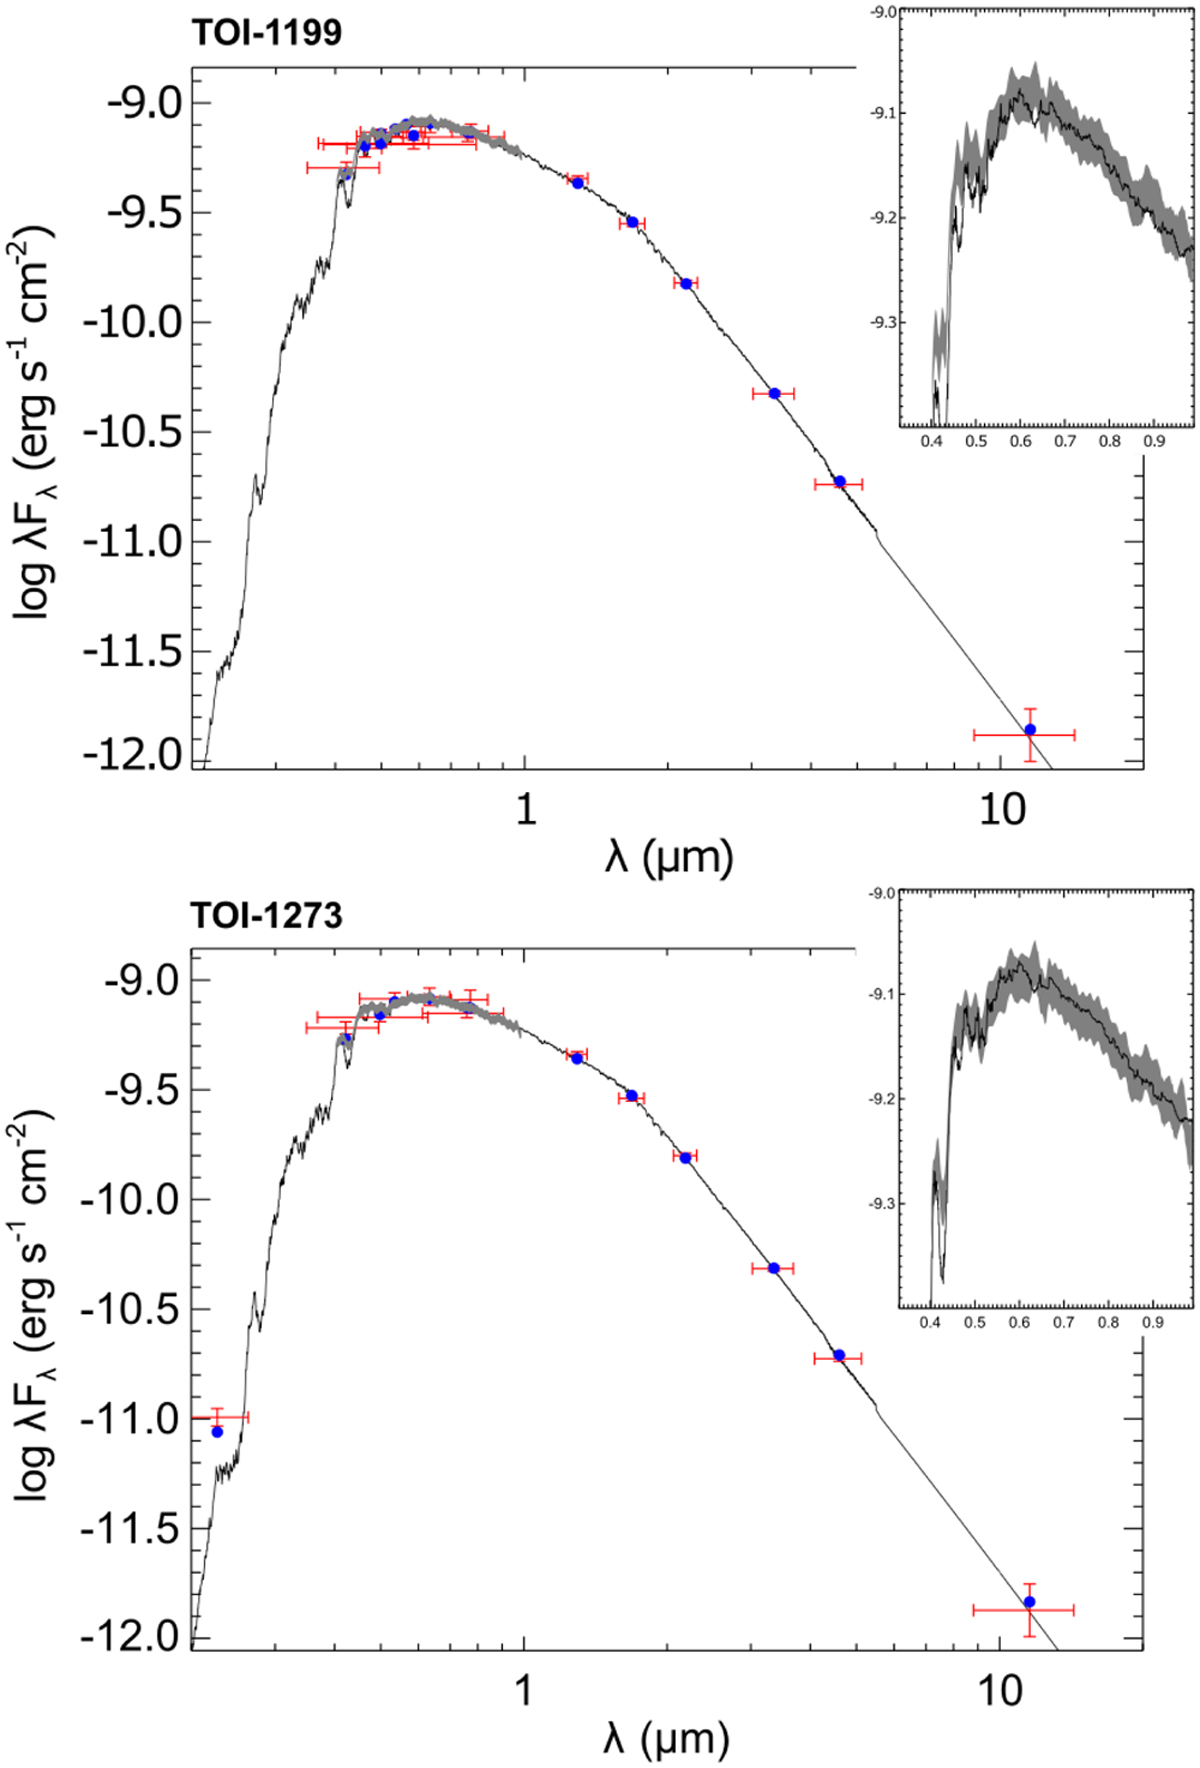
SEDs of TOI-1199 and TOI-1273. Red symbols represent the observed photometric measurements; the horizontal bars mark the effective width of the passband. Blue symbols are the model fluxes from the best-fit PHOENIX atmosphere model (black). The absolute flux-calibrated Gala spectrum is overlaid on the model SED as a gray swathe in the inset plots.
Current usage metrics show cumulative count of Article Views (full-text article views including HTML views, PDF and ePub downloads, according to the available data) and Abstracts Views on Vision4Press platform.
Data correspond to usage on the plateform after 2015. The current usage metrics is available 48-96 hours after online publication and is updated daily on week days.
Initial download of the metrics may take a while.