Fig. 4
Download original image
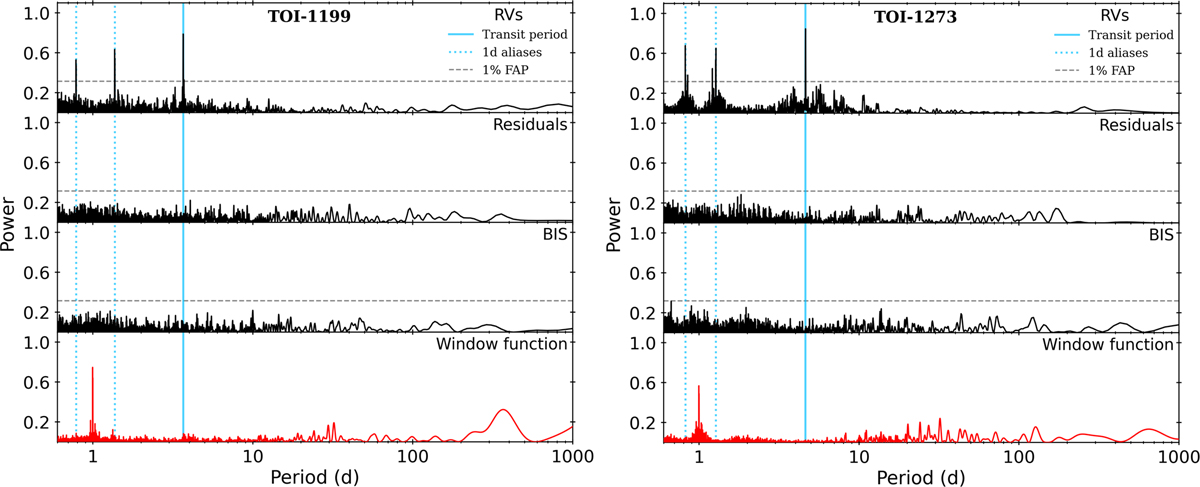
GLS periodograms of the SOPHIE RV time series, the residuals of the best-fit Keplerian model (from Sect. 3.2), the BIS, and the window function. For TOI-1199 (left panel) and TOI-1273 (right panel), the image shows the computed power spectrum of the GLS. In the RVs, the highest peak matches the transit period of the planet candidates, but the same signal is not present in the residuals, the BIS, or the window function. The analytical false alarm probability threshold of 1% is shown.
Current usage metrics show cumulative count of Article Views (full-text article views including HTML views, PDF and ePub downloads, according to the available data) and Abstracts Views on Vision4Press platform.
Data correspond to usage on the plateform after 2015. The current usage metrics is available 48-96 hours after online publication and is updated daily on week days.
Initial download of the metrics may take a while.