Fig. 11
Download original image
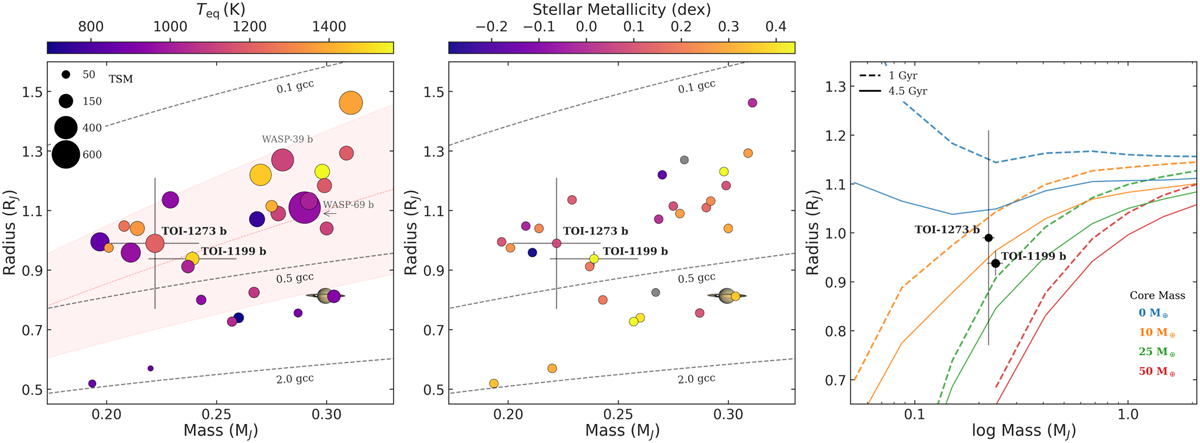
Radius-mass diagrams. Left panel: planetary mass and radius of the confirmed planet population with 1< P < 10 days and masses 60 < MP < 100 M⊕, with radii and masses determined to better than 20% precision. The gray dashed lines show constant density values of 0.1, 0.5 and 2.0 g cm−3. The position of Saturn is shown for comparison. The equilibrium temperatures for each planet are color coded and the markers are sized according to their TSM (Kempton et al. 2018). The R-M empirical relation found by Otegi et al. (2020) is shown by a dashed red line with the ±1σ regions colored. Two similar planets for which atmospheric characterization has been achieved are shown, namely WASP-39 b (Rustamkulov et al. 2023) and WASP-69 b (Khalafinejad et al. 2021; Lampón et al. 2023; Ouyang et al. 2023). Middle panel: same sample shown color coded by the metallicity of their host stars. Planets for which no host star metallicity determination is available are shown in gray. Right panel: Masses and radii of TOI-1199 b and TOI-1273 b shown along the structural models of Fortney et al. (2007) for planets at 0.045 AU.
Current usage metrics show cumulative count of Article Views (full-text article views including HTML views, PDF and ePub downloads, according to the available data) and Abstracts Views on Vision4Press platform.
Data correspond to usage on the plateform after 2015. The current usage metrics is available 48-96 hours after online publication and is updated daily on week days.
Initial download of the metrics may take a while.