Fig. 10
Download original image
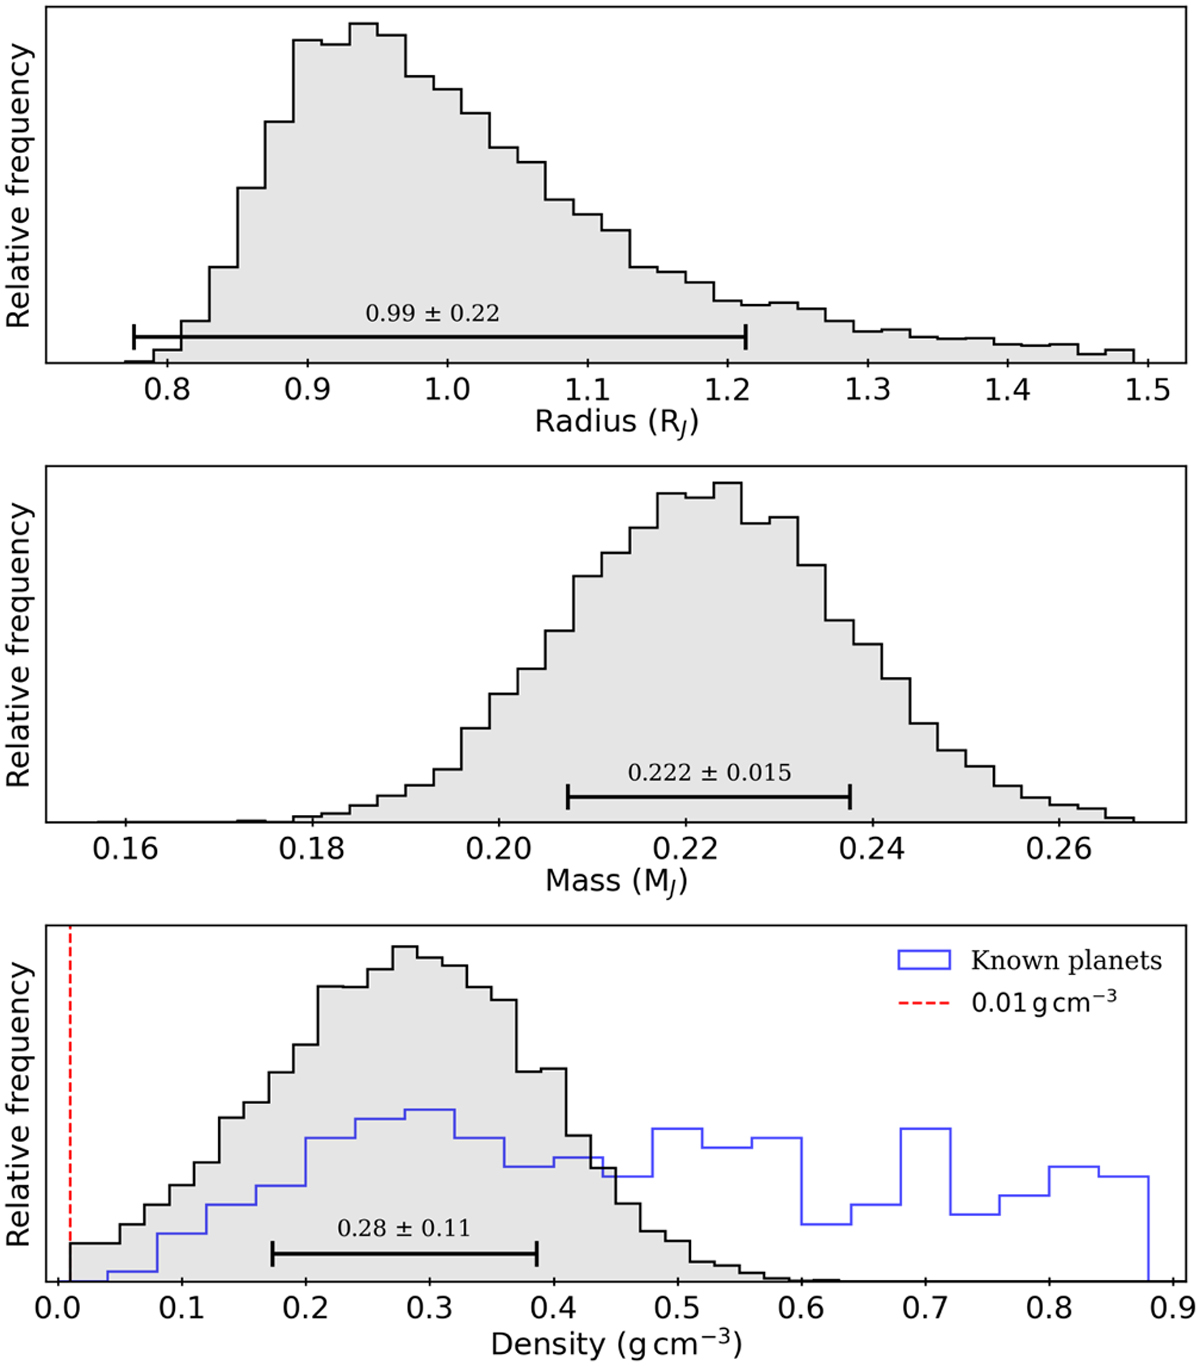
Histograms from the posterior distribution samples of TOI-1273 b (radius, mass, and density from top to bottom). The error bars represent the reported value for each parameter, which is the median ±1σ. The red dashed line on the lower panel shows the value at which we put the prior constraint on the density. In the lower panel the bulk density distribution of confirmed planets with masses and radii determined to better than 20% precision is also shown.
Current usage metrics show cumulative count of Article Views (full-text article views including HTML views, PDF and ePub downloads, according to the available data) and Abstracts Views on Vision4Press platform.
Data correspond to usage on the plateform after 2015. The current usage metrics is available 48-96 hours after online publication and is updated daily on week days.
Initial download of the metrics may take a while.