Fig. 9.
Download original image
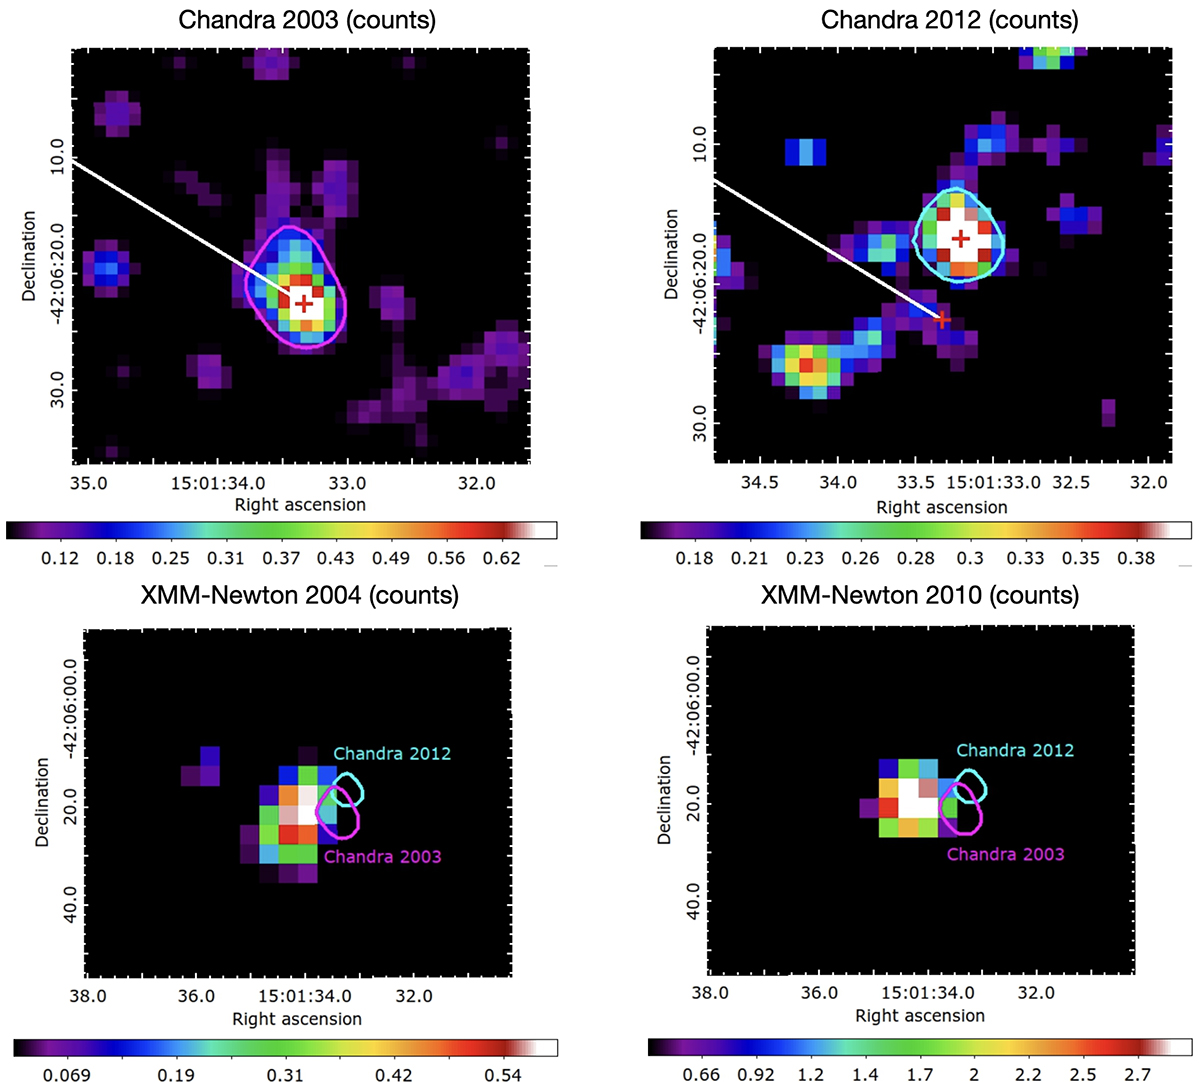
Chandra counts image observed in 2003, shown in the top-left panel. The red point shows the position of the source and the white line indicates the direction to the center of the remnant. The magenta region marks the shape of the source. The top-right panel: Chandra counts image observed in 2012. The northern red point indicates the position of the source and he cyan region marks its shape. Bottom-left panel: XMM-Newton counts image observed in 2004. Bottom-right panel: XMM-Newton counts image observed in 2010. The magenta and the cyan regions in both the lower panels indicate the source detected with Chandra in 2003 and 2012, respectively.
Current usage metrics show cumulative count of Article Views (full-text article views including HTML views, PDF and ePub downloads, according to the available data) and Abstracts Views on Vision4Press platform.
Data correspond to usage on the plateform after 2015. The current usage metrics is available 48-96 hours after online publication and is updated daily on week days.
Initial download of the metrics may take a while.