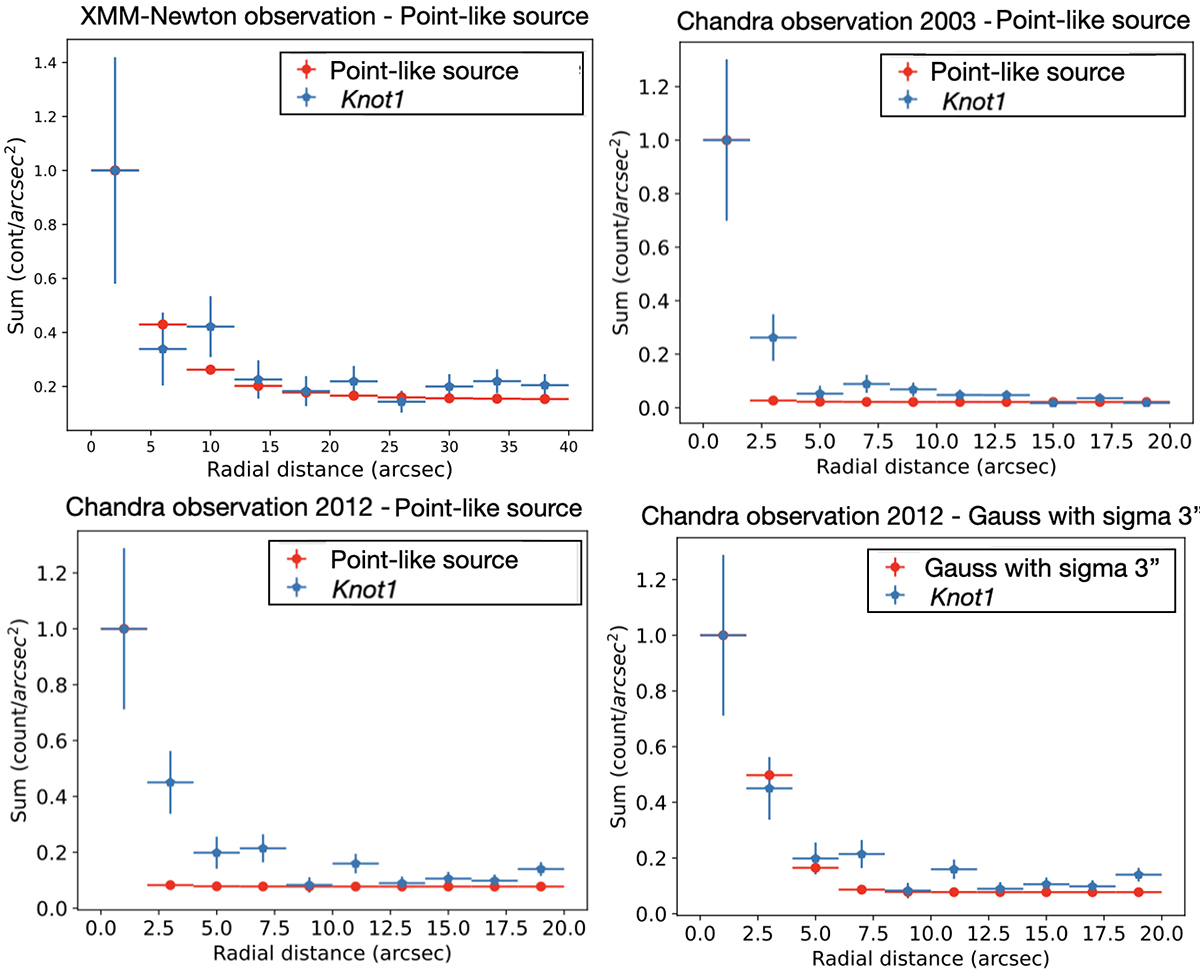
Fig. 4.
Download original image
Upper-left panel: comparison between the radial profiles of the knot1 surface brightness (blue crosses) and that of a simulated point-like source (red crosses, including the contribution of the background) for the XMM-Newton data. Upper-right panel: same as left panel, but for the Chandra 2003 observation. Lower-left panel: same as upper-right panel, but for the Chandra 2012 observation. Lower-right panel: same as lower-left panel, but for a simulated Gaussian profile with σ = 3″ (red crosses).
Current usage metrics show cumulative count of Article Views (full-text article views including HTML views, PDF and ePub downloads, according to the available data) and Abstracts Views on Vision4Press platform.
Data correspond to usage on the plateform after 2015. The current usage metrics is available 48-96 hours after online publication and is updated daily on week days.
Initial download of the metrics may take a while.