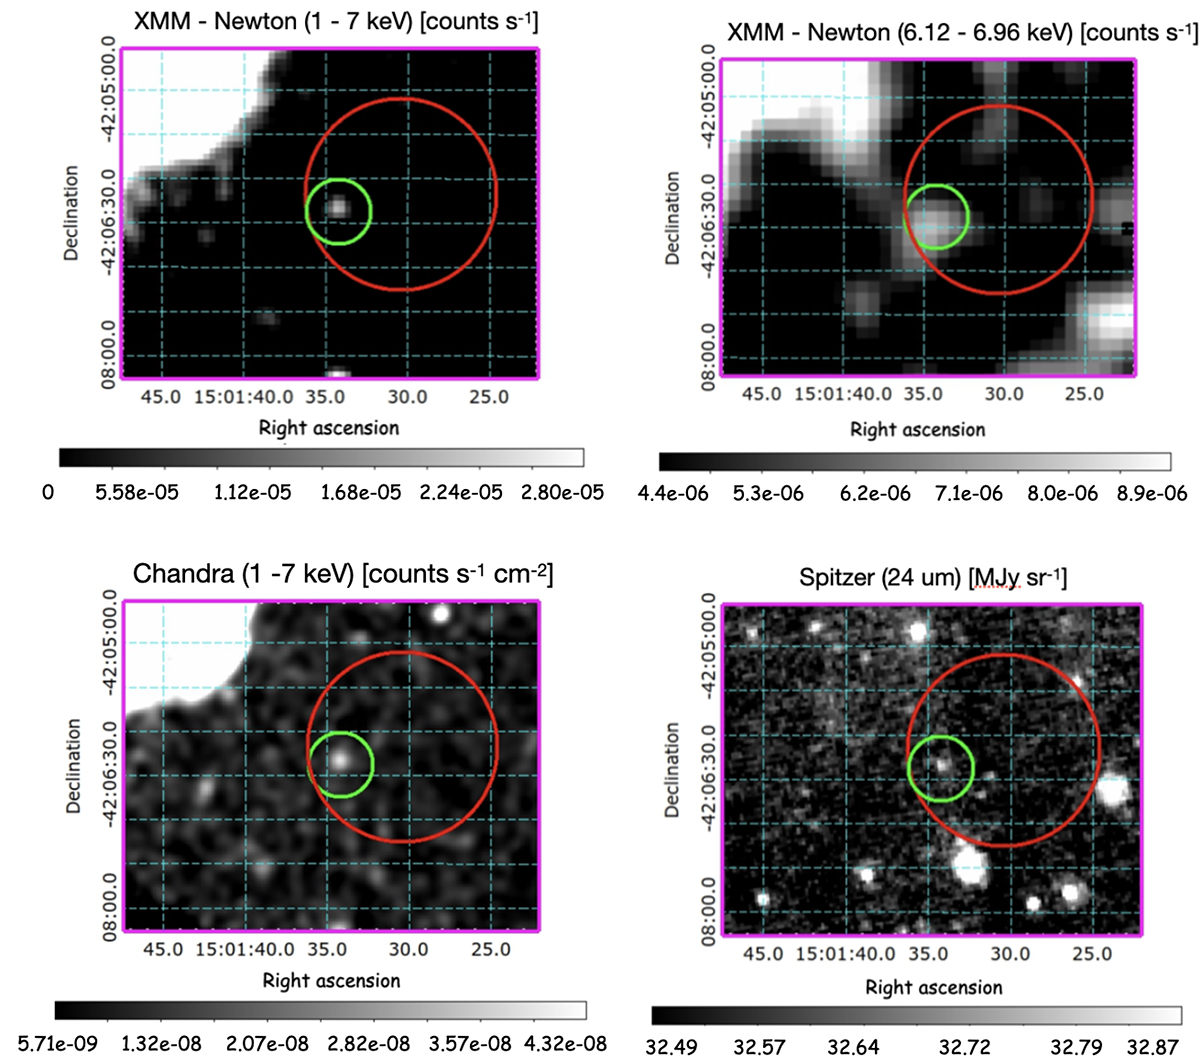
Fig. 3.
Download original image
XMM-Newton-EPIC count-rate map showing a close-up view of the southwestern limb of SN 1006 in the 1–7 keV band. Top-left panel: bin size of 4″. The red and green circles indicate the regions adopted to extract the NuSTAR and XMM-Newton spectra of knot1. The field of view corresponds to the magenta box in the right panel of Fig. 2. Top-right panel: same as the upper left panel in the 6.12 − 6.96 keV band, with bin size 8″. Lower-left panel: flux image of the same area in the 1–7 keV band (bin size 2″). Lower-right panel: IR emission of the same region, as observed with Spitzer at 24 μm.
Current usage metrics show cumulative count of Article Views (full-text article views including HTML views, PDF and ePub downloads, according to the available data) and Abstracts Views on Vision4Press platform.
Data correspond to usage on the plateform after 2015. The current usage metrics is available 48-96 hours after online publication and is updated daily on week days.
Initial download of the metrics may take a while.